

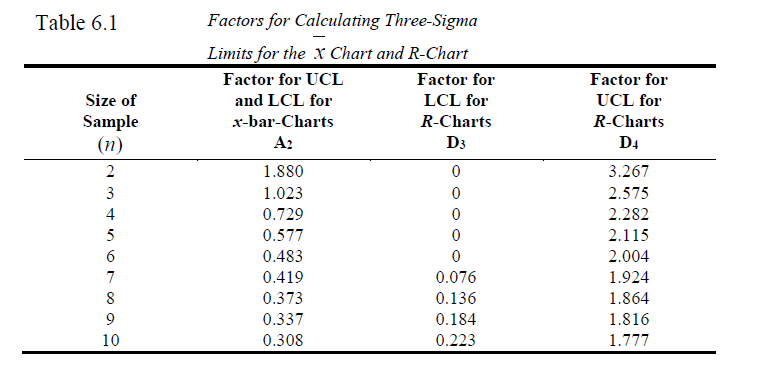
Question: 6. Use the table to the right for this problem. Historically, the average diameter of the holes drilled has been 0.15 cm and the average
| 6. Use the table to the right for this problem. Historically, the average diameter of the holes drilled has been 0.15 cm and the average range has been 0.1 cm. Samples of size 2 will be taken. Use the factors table above. What is the value of the upper control limit for the x-bar chart? (show 2 decimal places): |
Step by Step Solution
There are 3 Steps involved in it
1 Expert Approved Answer
Step: 1 Unlock

Question Has Been Solved by an Expert!
Get step-by-step solutions from verified subject matter experts
Step: 2 Unlock
Step: 3 Unlock