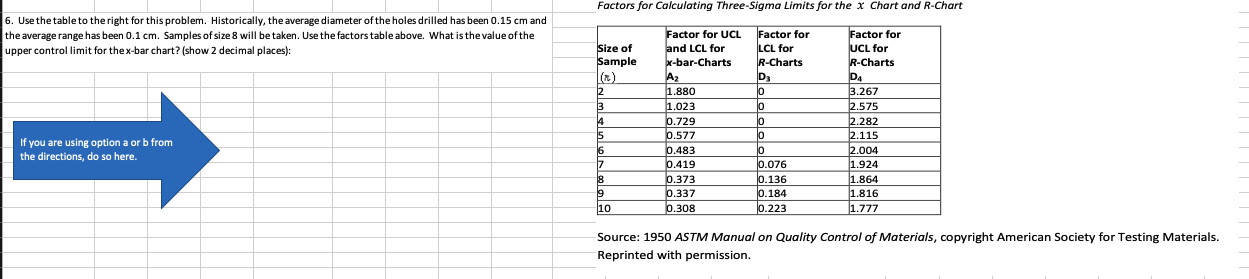
Question: Factors for Calculating Three-Sigma Limits for the x Chart and R-Chart 6. Use the table to the right for this problem. Historically, the average diameter

Factors for Calculating Three-Sigma Limits for

Factors for Calculating Three-Sigma Limits for the x Chart and R-Chart 6. Use the table to the right for this problem. Historically, the average diameter of the holes drilled has been 0.15 cm and the average range has been 0.1 cm. Samples of size 8 will be taken. Use the factors table above. What is the value of the upper controllimit for the x-bar chart? (show 2 decimal places): Size of Sample Factor for UCL and LCL for x-bar-Charts Factor for LCL for R-Charts D3 Factor for UCL for R-Charts If you are using option a orb from the directions, do so here. 1.880 1.023 0.729 0.577 0.483 0.419 0.373 0.337 6.308 lo lo lo 0.076 0.136 0.184 0.223 3.267 2.575 2.282 2.115 2.004 1.924 (1.864 (1.816 11.777 19 10 Source: 1950 ASTM Manual on Quality Control of Materials, copyright American Society for Testing Materials. Reprinted with permission

Step by Step Solution

There are 3 Steps involved in it

1 Expert Approved Answer
Step: 1 Unlock blur-text-image
Question Has Been Solved by an Expert!

Get step-by-step solutions from verified subject matter experts

Step: 2 Unlock
Step: 3 Unlock

Students Have Also Explored These Related General Management Questions!