

Question: Question 32 (3 points) Table 5.1 Size of Sample (m) 2 3 4 S 6 7 8 9 10 Factors for Calcung ThreeSign Limits for
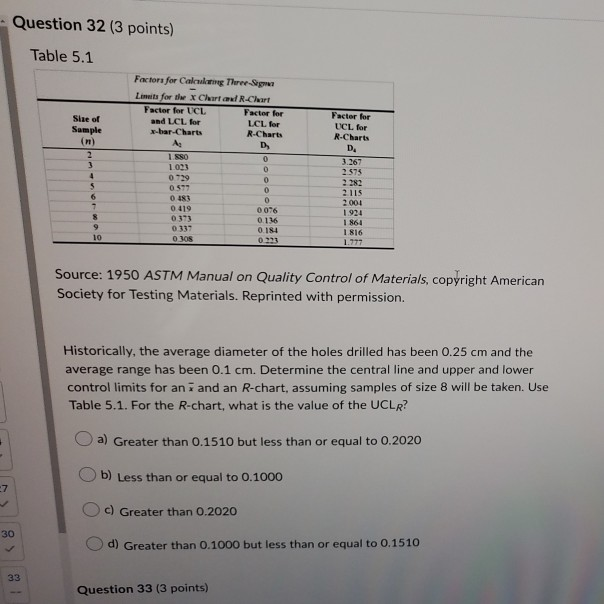
Question 32 (3 points) Table 5.1 Size of Sample (m) 2 3 4 S 6 7 8 9 10 Factors for Calcung ThreeSign Limits for the X Charta R-Chart Factor for UCL Factor for and LCL for LCL for x-bar-Charts R-Charts A. D 1.880 0 1023 0 0729 0 0577 0 0483 0 0419 0076 0.373 0.116 0339 0.184 0305 02 Factor for UCL for R-Charts D 3.367 2.575 2.282 2115 2001 1.924 1 864 1816 Source: 1950 ASTM Manual on Quality Control of Materials, copyright American Society for Testing Materials. Reprinted with permission. Historically, the average diameter of the holes drilled has been 0.25 cm and the average range has been 0.1 cm. Determine the central line and upper and lower control limits for an i and an R-chart, assuming samples of size 8 will be taken. Use Table 5.1. For the R-chart, what is the value of the UCLR? a) Greater than 0.1510 but less than or equal to 0.2020 b) Less than or equal to 0.1000 -7 c) Greater than 0.2020 30 d) Greater than 0.1000 but less than or equal to 0.1510 33 Question 33 (3 points)
Step by Step Solution
There are 3 Steps involved in it
1 Expert Approved Answer
Step: 1 Unlock

Question Has Been Solved by an Expert!
Get step-by-step solutions from verified subject matter experts
Step: 2 Unlock
Step: 3 Unlock