

Question: (6pts) Data Analysis (1pts) 1. Which motor oil sample had the highest viscosity at room temperature? (1pts) 2. Which motor oil sample had the highest
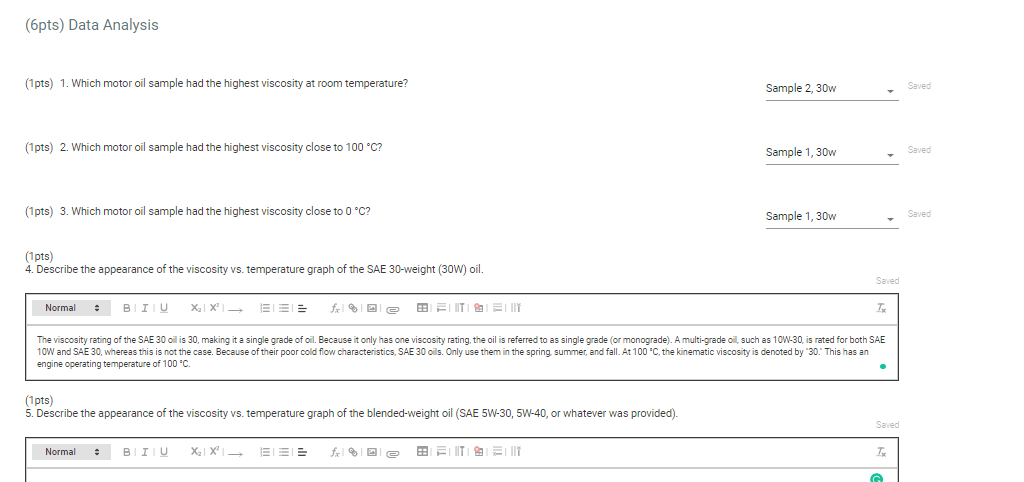
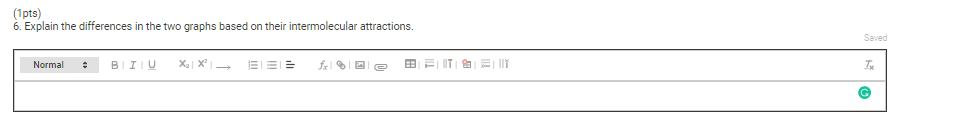
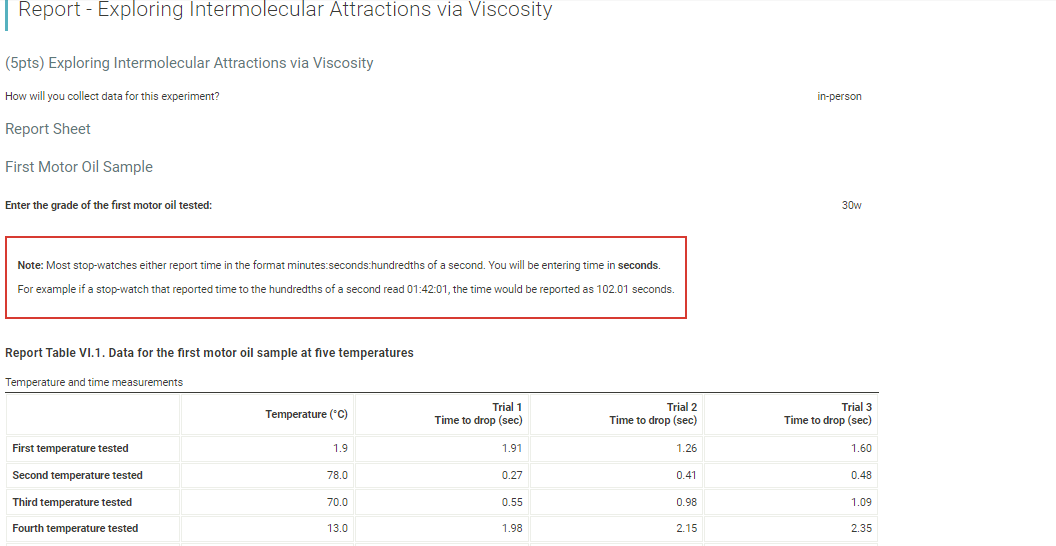
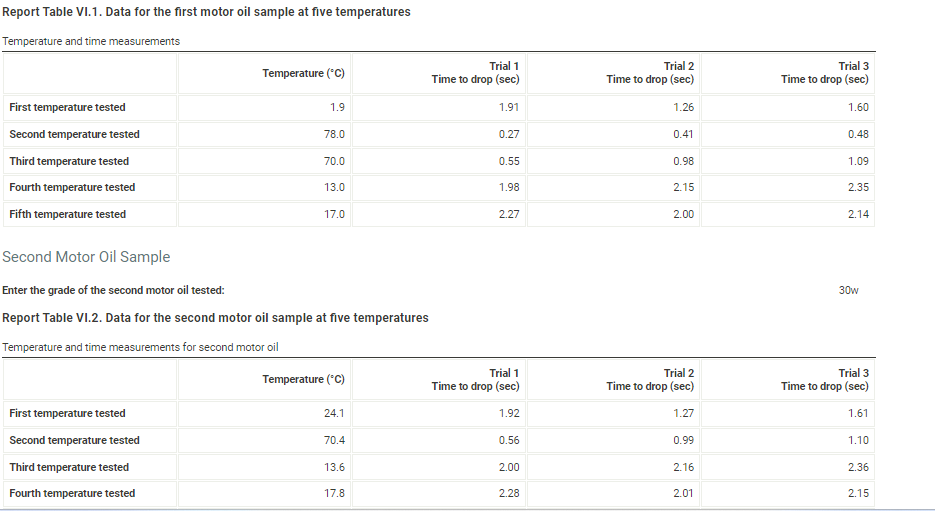
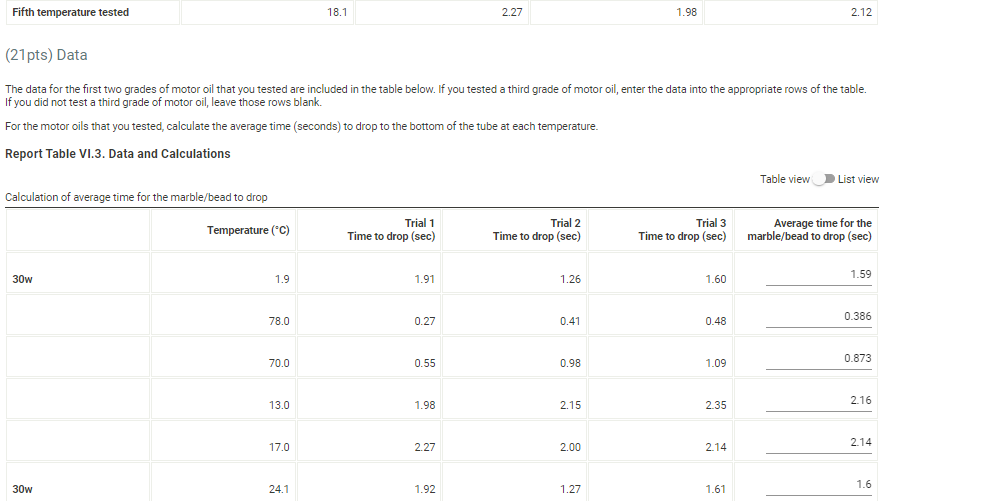
(6pts) Data Analysis (1pts) 1. Which motor oil sample had the highest viscosity at room temperature? (1pts) 2. Which motor oil sample had the highest viscosity close to 100C ? (1pts) 3. Which motor oil sample had the highest viscosity close to 0C ? Sample 1, 30w (1pts) 4. Describe the appearance of the viscosity vs. temperature graph of the SAE 30-weight (30W) oil. engine operating temperature of 100C. (1pts) 5. Describe the appearance of the viscosity vs. temperature graph of the blended-weight oil (SAE 5W-30, 5W40, or whatever was provided). (1pts) 6. Explain the differences in the two qraphs based on their intermolecular attractions. Note: Most stop-watches either report time in the format minutes:seconds:hundredths of a second. You will be entering time in seconds. For example if a stop-watch that reported time to the hundredths of a second read 01:42:01, the time would be reported as 102.01 seconds. Report Table VI.1. Data for the first motor oil sample at five temperatures Report Table VI.1. Data for the first motor oil sample at five temperatures Temperature and time measurements Second Motor Oil Sample Enter the grade of the second motor oil tested: 30w Report Table VI.2. Data for the second motor oil sample at five temperatures The data for the first two grades of motor oil that you tested are included in the table below. If you tested a third grade of motor oil, enter the data into the appropriate rows of the table. If you did not test a third grade of motor oil, leave those rows blank. For the motor oils that you tested, calculate the average time (seconds) to drop to the bottom of the tube at each temperature. Report Table VI.3. Data and Calculations Table view List view Calculation of average time for the marble/bead to drop
Step by Step Solution
There are 3 Steps involved in it

Get step-by-step solutions from verified subject matter experts