

Question: 7 . 1 1 * Figure 7 . 1 1 shows a pressure versus temperature phase diagram for a system exhibiting two solid - state
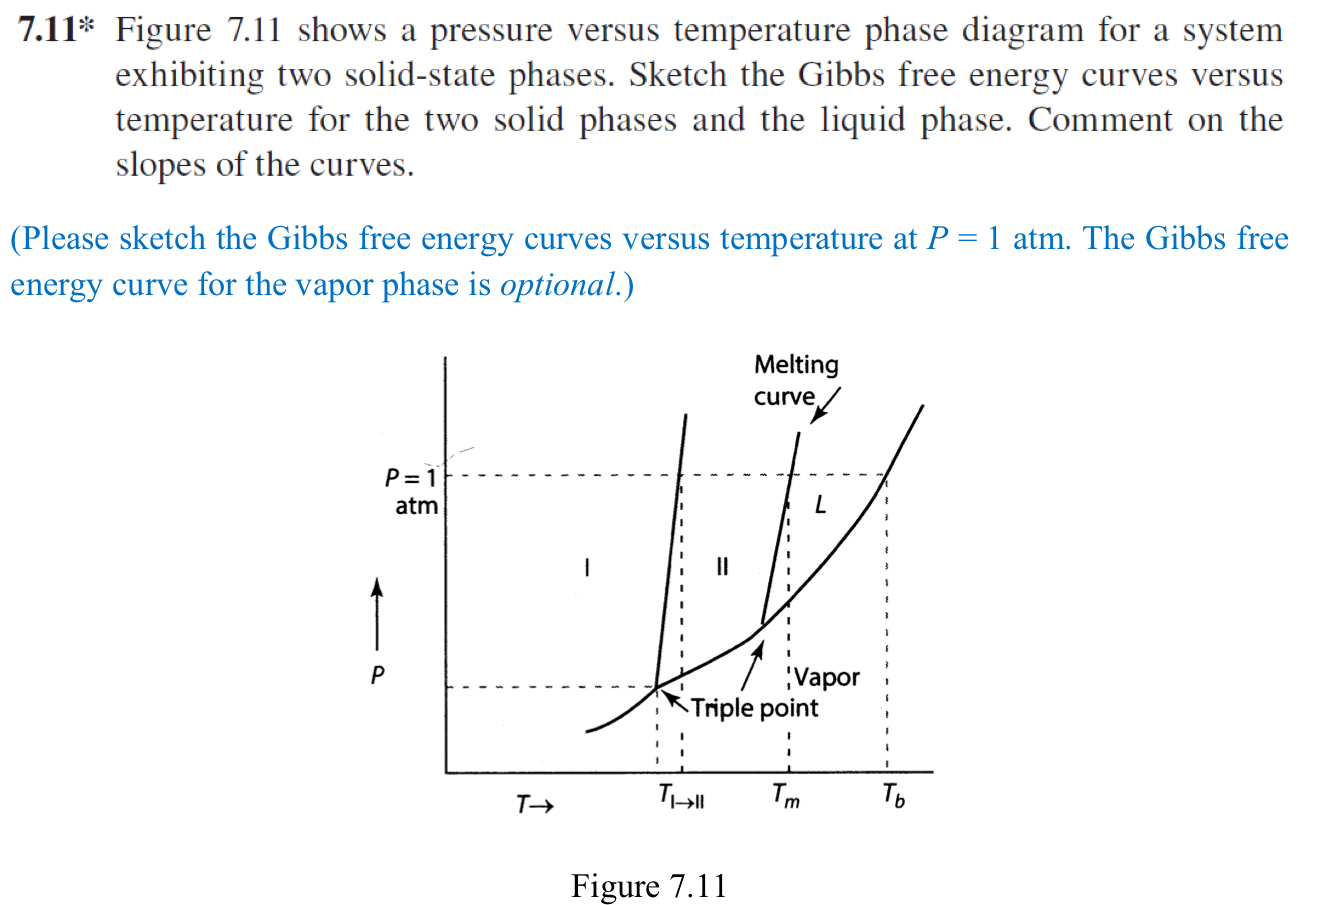
Figure shows a pressure versus temperature phase diagram for a system exhibiting two solidstate phases. Sketch the Gibbs free energy curves versus temperature for the two solid phases and the liquid phase. Comment on the slopes of the curves.
Please sketch the Gibbs free energy curves versus temperature at atm. The Gibbs free energy curve for the vapor phase is optional.
Figure
Step by Step Solution
There are 3 Steps involved in it
1 Expert Approved Answer
Step: 1 Unlock

Question Has Been Solved by an Expert!
Get step-by-step solutions from verified subject matter experts
Step: 2 Unlock
Step: 3 Unlock