

Question: Figure a & b shows a pressure versus temperature phase diagram for a system exhibiting two solid-state phases. Sketch the Gibbs free energy curves versus
Figure a & b shows a pressure versus temperature phase diagram for a system exhibiting two solid-state phases. Sketch the Gibbs free energy curves versus temperature for the two solid phases and the liquid phase. Comment on the slopes of the curves.
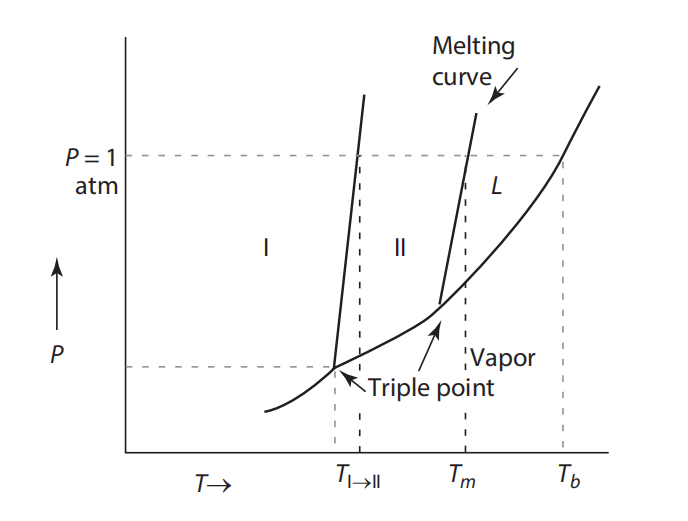
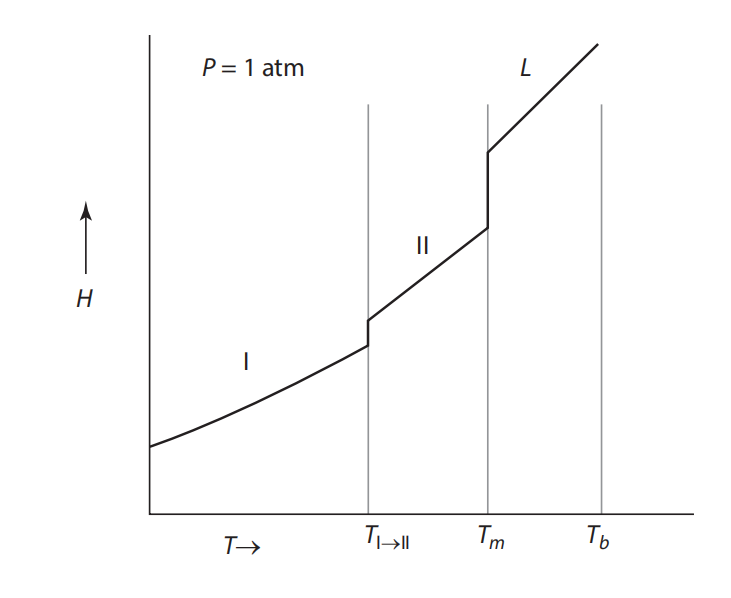
(a) Schematic pressure vs. temperature diagram of a system with two solid-state phases (I and II) and a liquid phase. (b) Schematic enthalpy vs. temperature diagram of the system in Figure a, showing the transformation temperature from I to II, the melting temperature, and the boiling temperature.
Melting curve vey P= 1 atm L 1 II 1 Vapor Triple point T Tall Tm To = 1 atm L II H Tm T
Step by Step Solution
There are 3 Steps involved in it

Get step-by-step solutions from verified subject matter experts