

Question: 7 1 point The frequency graph below represents the scores of a class on a mathematics exam. Using your knowledge of mean, median, mode,
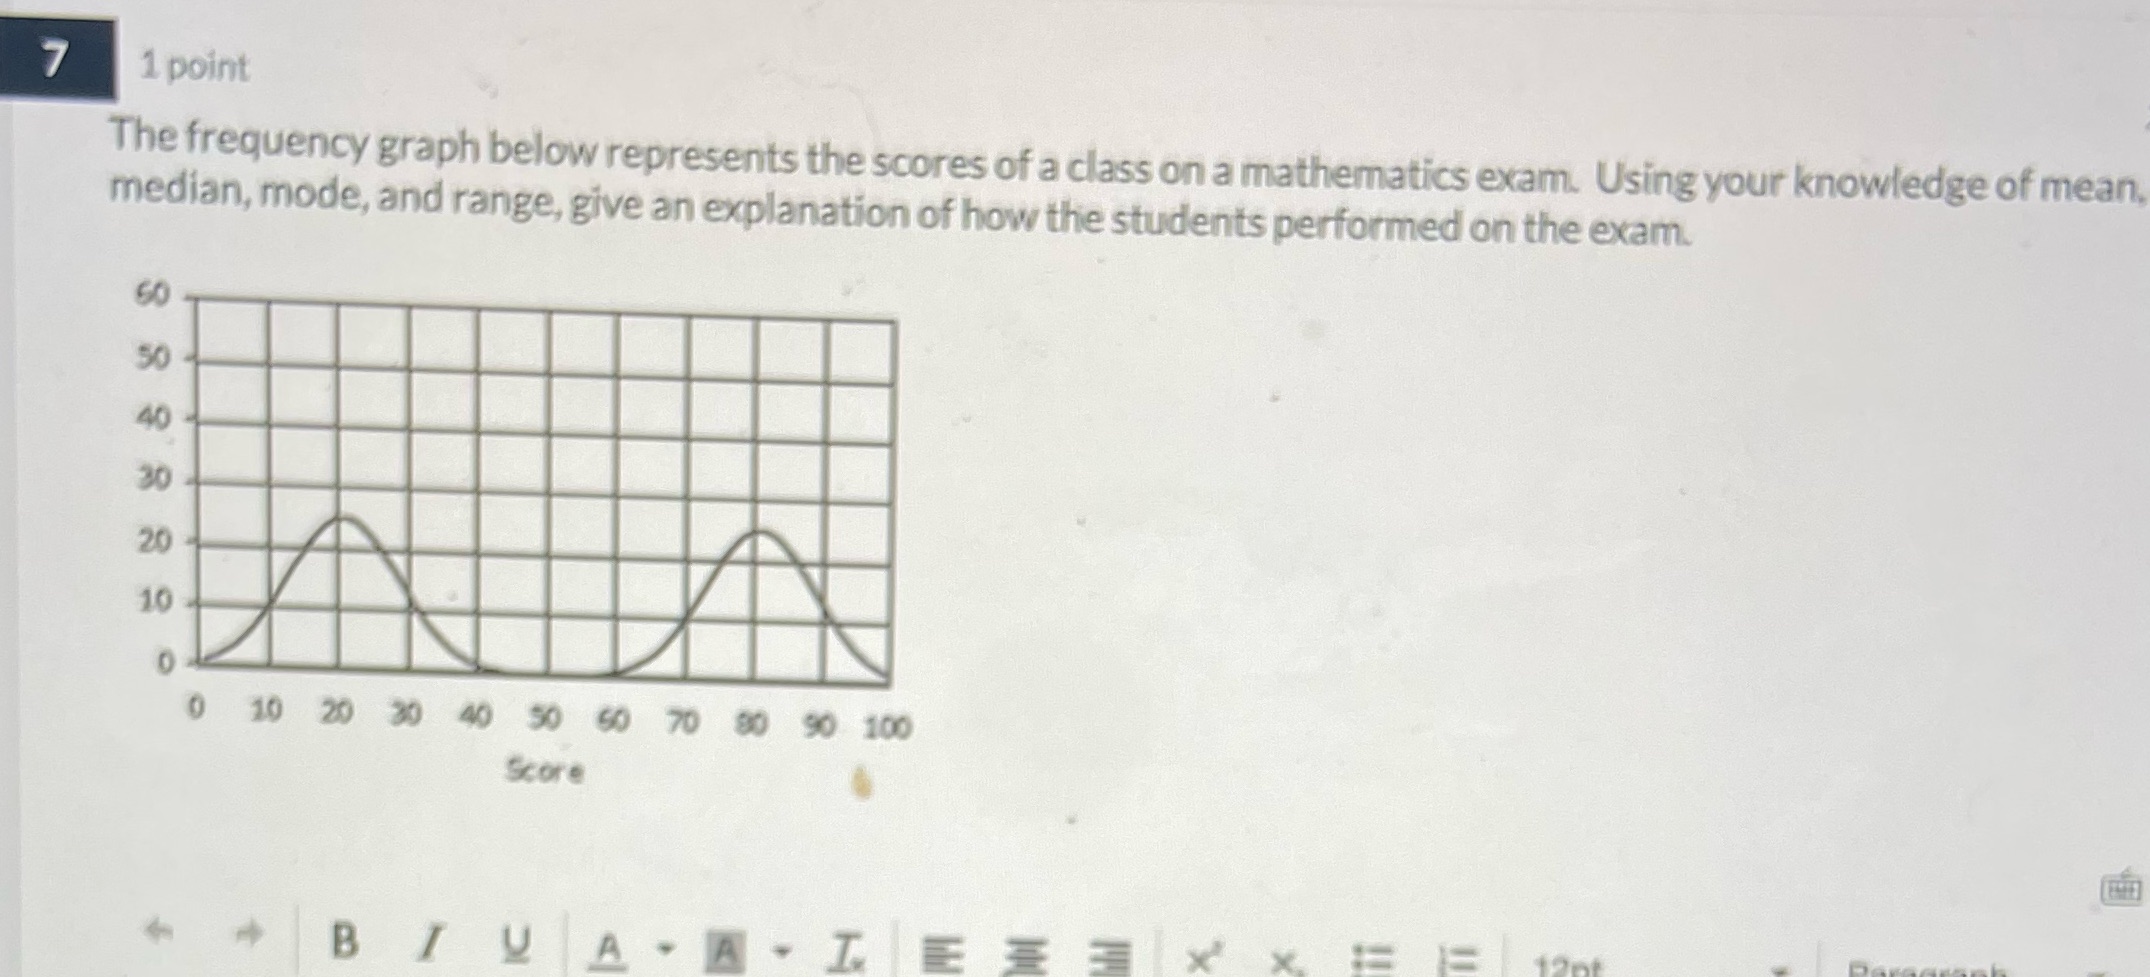
7 1 point The frequency graph below represents the scores of a class on a mathematics exam. Using your knowledge of mean, median, mode, and range, give an explanation of how the students performed on the exam. 30 40 88 8 8 8 8 20 10 0 0 10 20 30 40 50 50 70 80 90 100 Score BIVAA - E = x = = 12pt
Step by Step Solution
There are 3 Steps involved in it
1 Expert Approved Answer
Step: 1 Unlock

Question Has Been Solved by an Expert!
Get step-by-step solutions from verified subject matter experts
Step: 2 Unlock
Step: 3 Unlock