Question: 7. (30 points) You are a teaching assistant (TA) for a new course in the department and you wish to measure the amount of

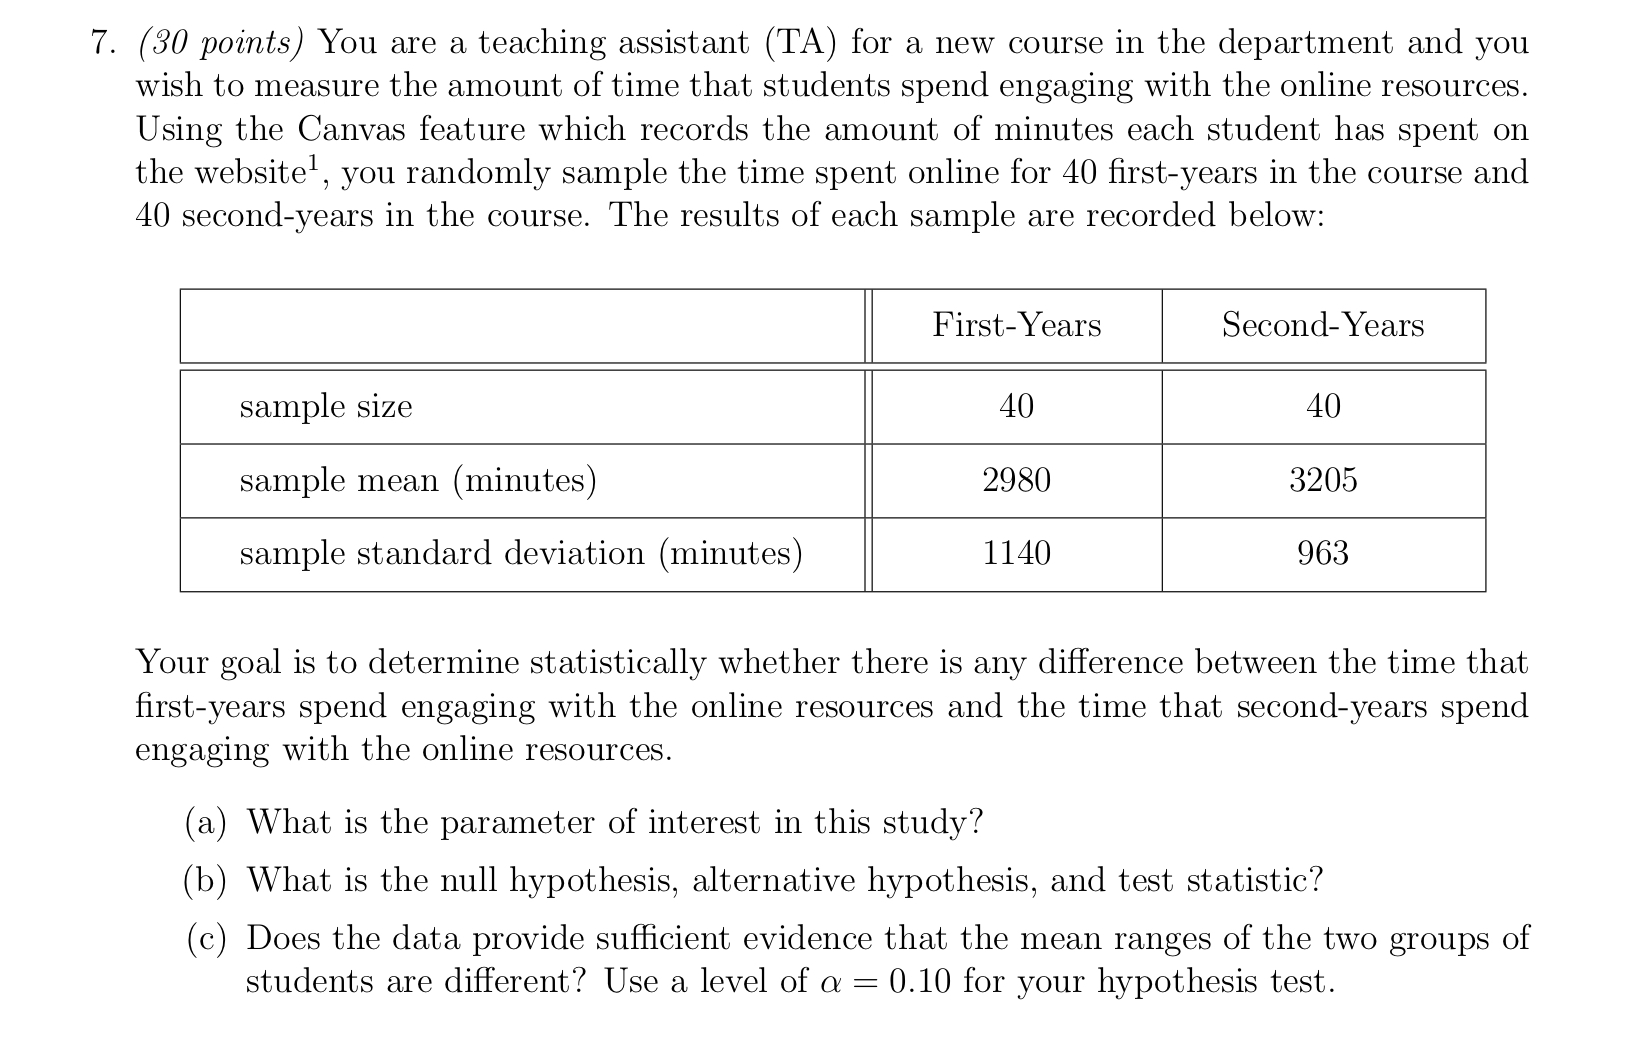
7. (30 points) You are a teaching assistant (TA) for a new course in the department and you wish to measure the amount of time that students spend engaging with the online resources. Using the Canvas feature which records the amount of minutes each student has spent on the website, you randomly sample the time spent online for 40 first-years in the course and 40 second-years in the course. The results of each sample are recorded below: sample size sample mean (minutes) sample standard deviation (minutes) First-Years Second-Years 40 40 2980 3205 1140 963 Your goal is to determine statistically whether there is any difference between the time that first-years spend engaging with the online resources and the time that second-years spend engaging with the online resources. (a) What is the parameter of interest in this study? (b) What is the null hypothesis, alternative hypothesis, and test statistic? (c) Does the data provide sufficient evidence that the mean ranges of the two groups of students are different? Use a level of a = = 0.10 for your hypothesis test.
Step by Step Solution
There are 3 Steps involved in it

Get step-by-step solutions from verified subject matter experts


