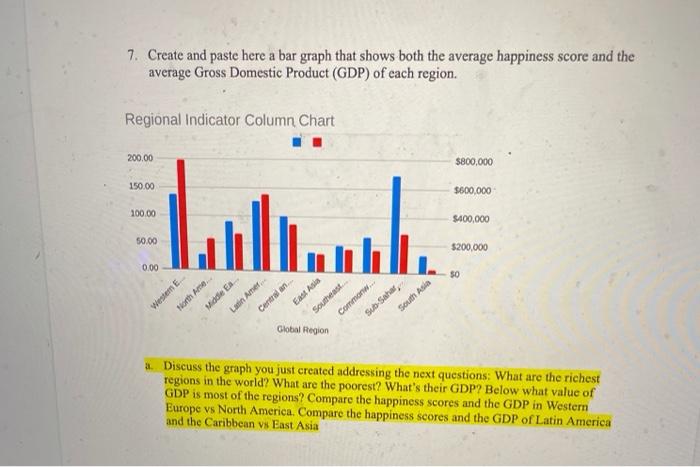
Question: 7. Create and paste here a bar graph that shows both the average happiness score and the average Gross Domestic Product (GDP) of each region.

7. Create and paste here a bar graph that shows
7. Create and paste here a bar graph that shows both the average happiness score and the average Gross Domestic Product (GDP) of each region. Regional Indicator Column Chart 200.00 $800,000 150.00 $600,000 100.00 ... $400,000 50.00 $200,000 0.00 50 Westem E Centran East Asia Southeast North Am. Middle EA Latin Amer Global Region Commonw.. SubSahar, South Asia Discuss the graph you just created addressing the next questions: What are the richest regions in the world? What are the poorest? What's their GDP? Below what value of GDP is most of the regions? Compare the happiness scores and the GDP in Western Europe vs North America. Compare the happiness scores and the GDP of Latin America and the Caribbean vs East Asia

Step by Step Solution

There are 3 Steps involved in it

1 Expert Approved Answer
Step: 1 Unlock blur-text-image
Question Has Been Solved by an Expert!

Get step-by-step solutions from verified subject matter experts

Step: 2 Unlock
Step: 3 Unlock

Students Have Also Explored These Related General Management Questions!