

Question: 7. Find the standard deviation, s, of sample data summarized in the frequency distribution table below by using the form below, where x represents the
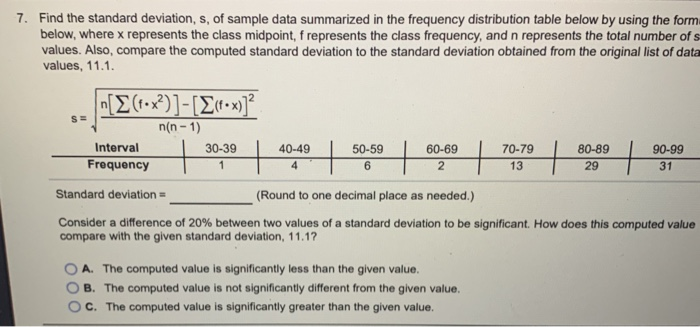
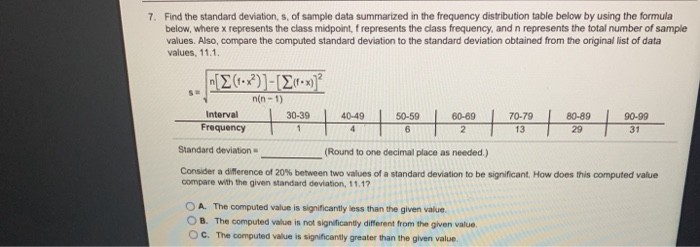
7. Find the standard deviation, s, of sample data summarized in the frequency distribution table below by using the form below, where x represents the class midpoint, f represents the class frequency, and n represents the total number of values. Also, compare the computed standard deviation to the standard deviation obtained from the original list of data values, 11.1. SE [{(tx?)]- [>
Step by Step Solution
There are 3 Steps involved in it
1 Expert Approved Answer
Step: 1 Unlock

Question Has Been Solved by an Expert!
Get step-by-step solutions from verified subject matter experts
Step: 2 Unlock
Step: 3 Unlock