

Question: 7. Shown below is a scatterplot of y versus x. Which choice is most likely to be the approximate value of R2, the proportion of
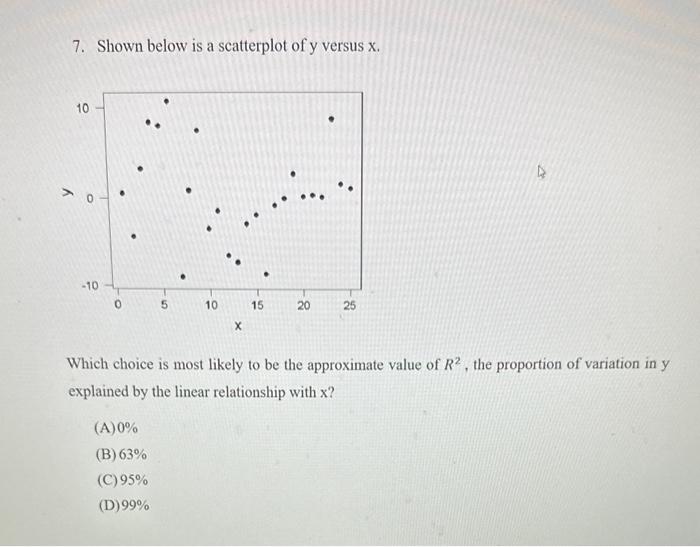
7. Shown below is a scatterplot of y versus x. Which choice is most likely to be the approximate value of R2, the proportion of variation in y explained by the linear relationship with x ? (A) 0% (B) 63% (C) 95% (D) 99%
Step by Step Solution
There are 3 Steps involved in it
1 Expert Approved Answer
Step: 1 Unlock

Question Has Been Solved by an Expert!
Get step-by-step solutions from verified subject matter experts
Step: 2 Unlock
Step: 3 Unlock