

Question: 7. Stress. The table below shows the relationship between a stress test score and the diastolic blood pressure for 8 patients. A linear regression model
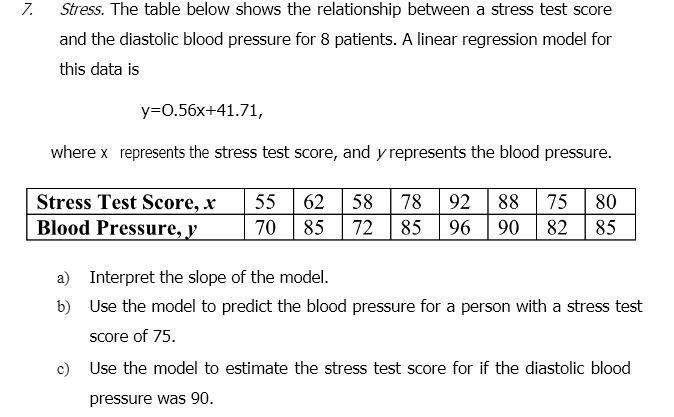
7. Stress. The table below shows the relationship between a stress test score and the diastolic blood pressure for 8 patients. A linear regression model for this data is y=0.56x+41.71, where x represents the stress test score, and y represents the blood pressure. Stress Test Score, x 55 62 58 78 92 88 75 80 Blood Pressure, y 70 85 72 85 96 90 82 85 a) Interpret the slope of the model. b) Use the model to predict the blood pressure for a person with a stress test score of 75. c) Use the model to estimate the stress test score for if the diastolic blood pressure was 90
Step by Step Solution
There are 3 Steps involved in it
1 Expert Approved Answer
Step: 1 Unlock

Question Has Been Solved by an Expert!
Get step-by-step solutions from verified subject matter experts
Step: 2 Unlock
Step: 3 Unlock