

Question: 7. The average return for Firm A is calculated as 0.05 (5%) with a standard deviation of 0.03 (3%). The average return for Firm B
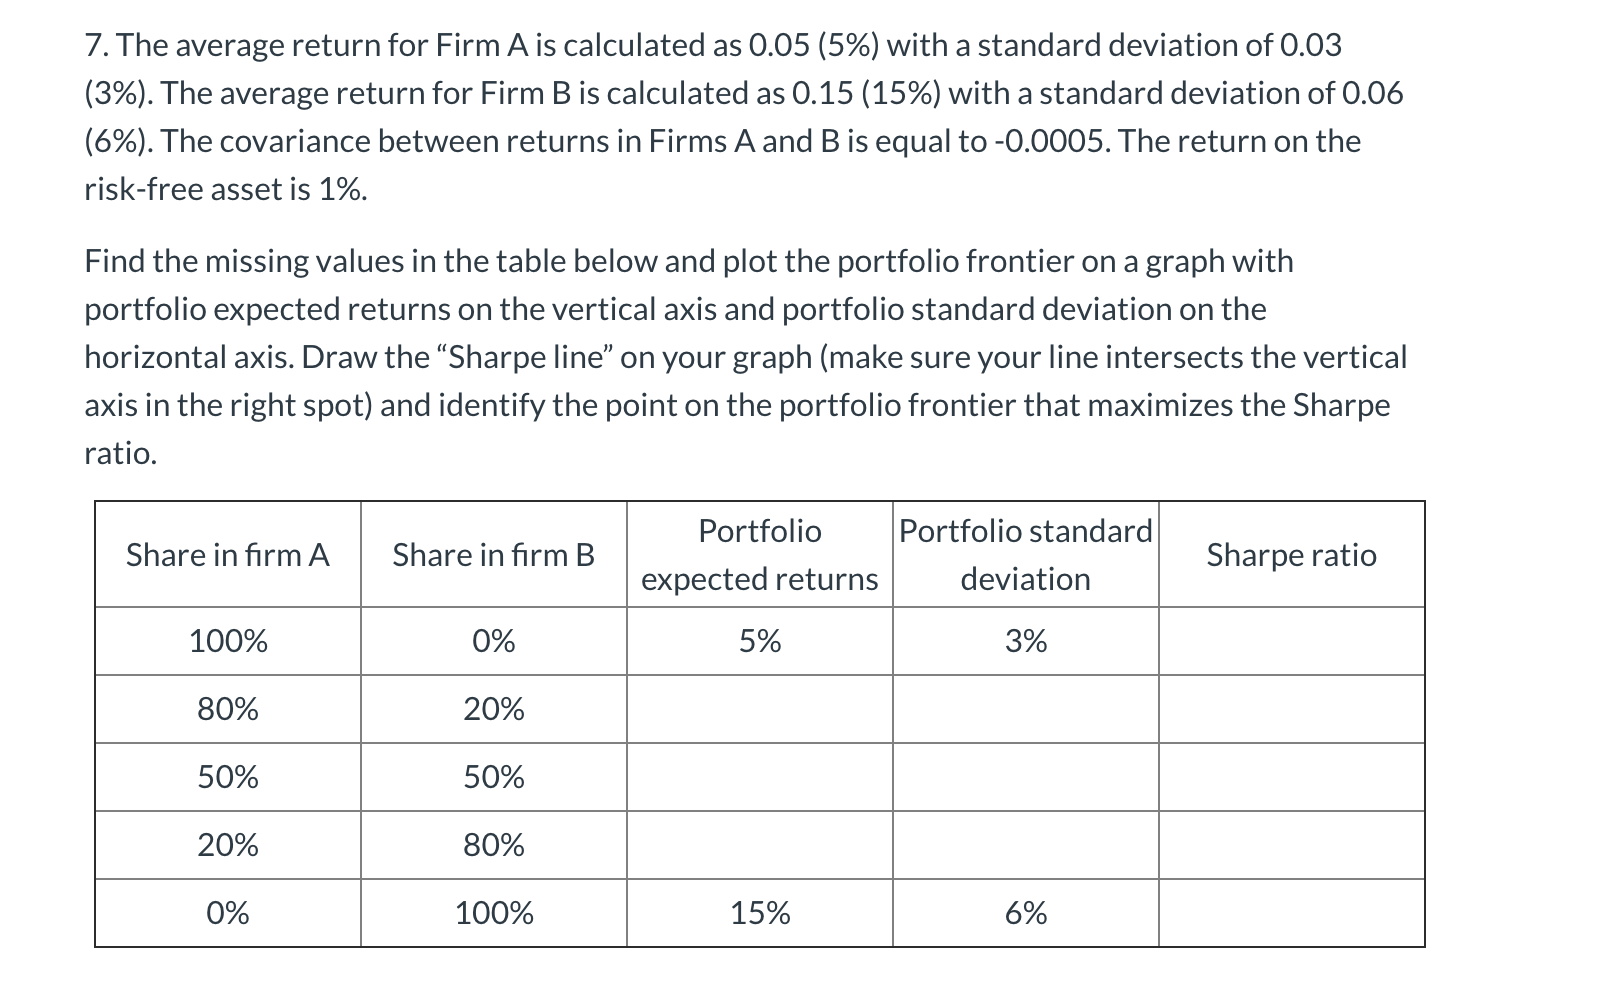
7. The average return for Firm A is calculated as 0.05 (5%) with a standard deviation of 0.03 (3%). The average return for Firm B is calculated as 0.15 (15%) with a standard deviation of 0.06 (6%). The covariance between returns in Firms A and B is equal to -0.0005. The return on the risk-free asset is 1%. Find the missing values in the table below and plot the portfolio frontier on a graph with portfolio expected returns on the vertical axis and portfolio standard deviation on the horizontal axis. Draw the Sharpe line on your graph (make sure your line intersects the vertical axis in the right spot) and identify the point on the portfolio frontier that maximizes the Sharpe ratio. Share in firm A Share in firm B Portfolio expected returns Portfolio standard deviation Sharpe ratio 100% 0% 5% 3% 80% 20% 50% 50% 20% 80% 0% 100% 15% 6%
Step by Step Solution
There are 3 Steps involved in it

Get step-by-step solutions from verified subject matter experts