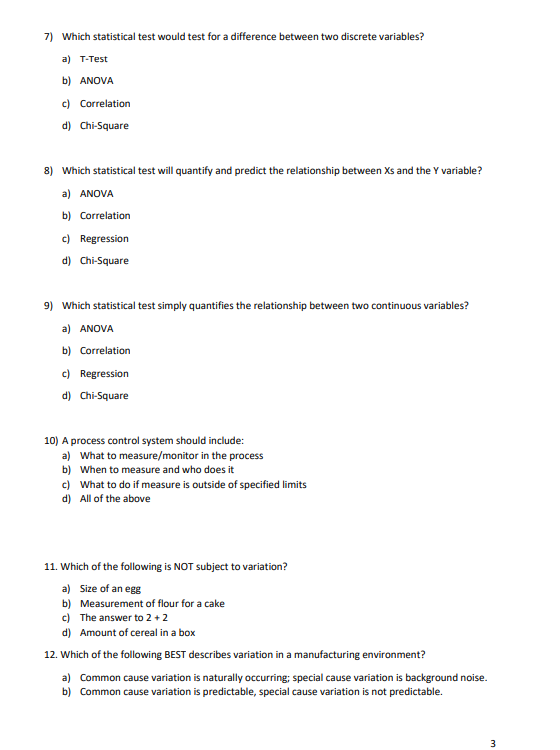
Question: 7) Which statistical test would test for a difference between two discrete variables? a) T-Test b) ANOVA c) Correlation d) Chi-Square 8) Which statistical test

7) Which statistical test would test for a7) Which statistical test would test for a

7) Which statistical test would test for a difference between two discrete variables? a) T-Test b) ANOVA c) Correlation d) Chi-Square 8) Which statistical test will quantify and predict the relationship between Xs and the Y variable? a) ANOVA b) Correlation c) Regression d) Chi-Square 9) Which statistical test simply quantifies the relationship between two continuous variables? a) ANOVA b) Correlation c) Regression d) Chi-Square 10) A process control system should include: a) What to measure/monitor in the process b) When to measure and who does it c) What to do if measure is outside of specified limits d) All of the above 11. Which of the following is NOT subject to variation? a) Size of an egg b) Measurement of flour for a cake c) The answer to 2+2 d) Amount of cereal in a box 12. Which of the following BEST describes variation in a manufacturing environment? a) Common cause variation is naturally occurring; special cause variation is background noise. b) Common cause variation is predictable, special cause variation is not predictable. 3 c) Natural variation is background noise that is expected, special cause variation is inherent to the process. d) Any variation in a process is undesirable and one should strive to reduce or eliminate it if possible. 13. What specific method in manufacturing is used to monitor variation? a) Design of Experiments (DOE) b) Statistical Process Control (SPC) c) Continuous Quality Control d) Lean Manufacturing 14. Which of the following BEST describes the goal of Statistical Process Control (SPC)? The goal of SPC is to... a) provide statistical information about a process and how specific process parameters are varying over time. b) eliminate or reduce any and all variation from each step in a manufacturing process. c) improve a process through daily observations, adjustments, and data gathering. d) provide process technicians with data that allow them to make adjustments to a process before it goes out of control 15. Most of the data used in Statistical Process Control is assumed to have what type of distribution? a) Even b) Normal c) Poisson d) Logarithmic 16. What is the tool most commonly used to monitor daily variation in a manufacturing process? a) Histograms b) Pareto Charts c) Control Charts d) Process Flowcharts 17. Which of the following BEST describes a control chart? a) Identifies common and special variation that can exists in a process b) Shows the variation of a process over time using actual process data c) Uses process data to determine how a process is meeting process specifications d) Identifies parameters that can be adjusted to reduce process variation 18. What type of data is plotted on an xbar-R Control Chart? a) Variable b) Normal c) Attribute d) Logarithmic

Step by Step Solution

There are 3 Steps involved in it

1 Expert Approved Answer
Step: 1 Unlock blur-text-image
Question Has Been Solved by an Expert!

Get step-by-step solutions from verified subject matter experts

Step: 2 Unlock
Step: 3 Unlock

Students Have Also Explored These Related General Management Questions!