

Question: 7-13 helppp Consider the data contained in the table below, which lists 30 monthly excess returns to two different actively managed stock portfolios (A and
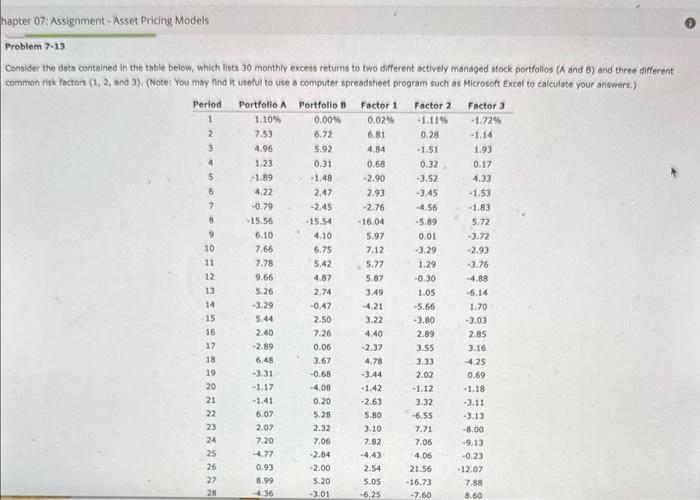
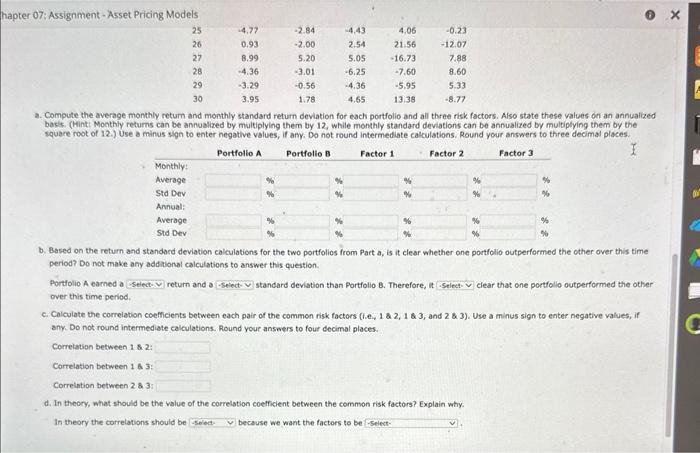
Consider the data contained in the table below, which lists 30 monthly excess returns to two different actively managed stock portfolios (A and B) and three different ommon risk factors (1,2, and 3). (Note: You may hind it useful to use a computer spreadsheet program such as Microsoft Excel to calculate your answers.) a. Compute the average monthly retum and monthly standard return deviation for each portfolio and all three risk factors. Aiso state these values on an annualized bask. (Hintt Monthly returns can be annualized by multiplying them by 12 , while monthly standard deviations can be annualized by multiplying them by the squere root of 12.) Use a minus shgn to enter hegative values, if amy. Do not round intermediate calculations. Round your aniwers to three decimal places. b. Based on the return and standard deviation calculations for the two portfolios from Part a, is it clear whether one portfolio outperformed the other over this time period? Do not mave any additional calculations to answer this question. Portfolio A earned a return and a clear that one portfollo outperformed the other over this time period. c. Calculate the correiation coefficients between each pair of the common risk factors (. e., 182,183 , and 283 ). Use a minus sign to enter negative values, if any. Do not round intermediate calculations. Round your answers to four decimal places. Corretation between 18.2 . Correlation between 1 a 3 : Correlintion between 28 3: d. In theory, what should be the value of the correlation coetficient between the common risk factors? Explain why. In theory the carrelations should be because we want the factors to be Consider the data contained in the table below, which lists 30 monthly excess returns to two different actively managed stock portfolios (A and B) and three different ommon risk factors (1,2, and 3). (Note: You may hind it useful to use a computer spreadsheet program such as Microsoft Excel to calculate your answers.) a. Compute the average monthly retum and monthly standard return deviation for each portfolio and all three risk factors. Aiso state these values on an annualized bask. (Hintt Monthly returns can be annualized by multiplying them by 12 , while monthly standard deviations can be annualized by multiplying them by the squere root of 12.) Use a minus shgn to enter hegative values, if amy. Do not round intermediate calculations. Round your aniwers to three decimal places. b. Based on the return and standard deviation calculations for the two portfolios from Part a, is it clear whether one portfolio outperformed the other over this time period? Do not mave any additional calculations to answer this question. Portfolio A earned a return and a clear that one portfollo outperformed the other over this time period. c. Calculate the correiation coefficients between each pair of the common risk factors (. e., 182,183 , and 283 ). Use a minus sign to enter negative values, if any. Do not round intermediate calculations. Round your answers to four decimal places. Corretation between 18.2 . Correlation between 1 a 3 : Correlintion between 28 3: d. In theory, what should be the value of the correlation coetficient between the common risk factors? Explain why. In theory the carrelations should be because we want the factors to be
Step by Step Solution
There are 3 Steps involved in it

Get step-by-step solutions from verified subject matter experts