

Question: 7:37 C 30 X Math in Context 7.2B 5) MA th in Context 7.2: World record times for the What do the slopes of the
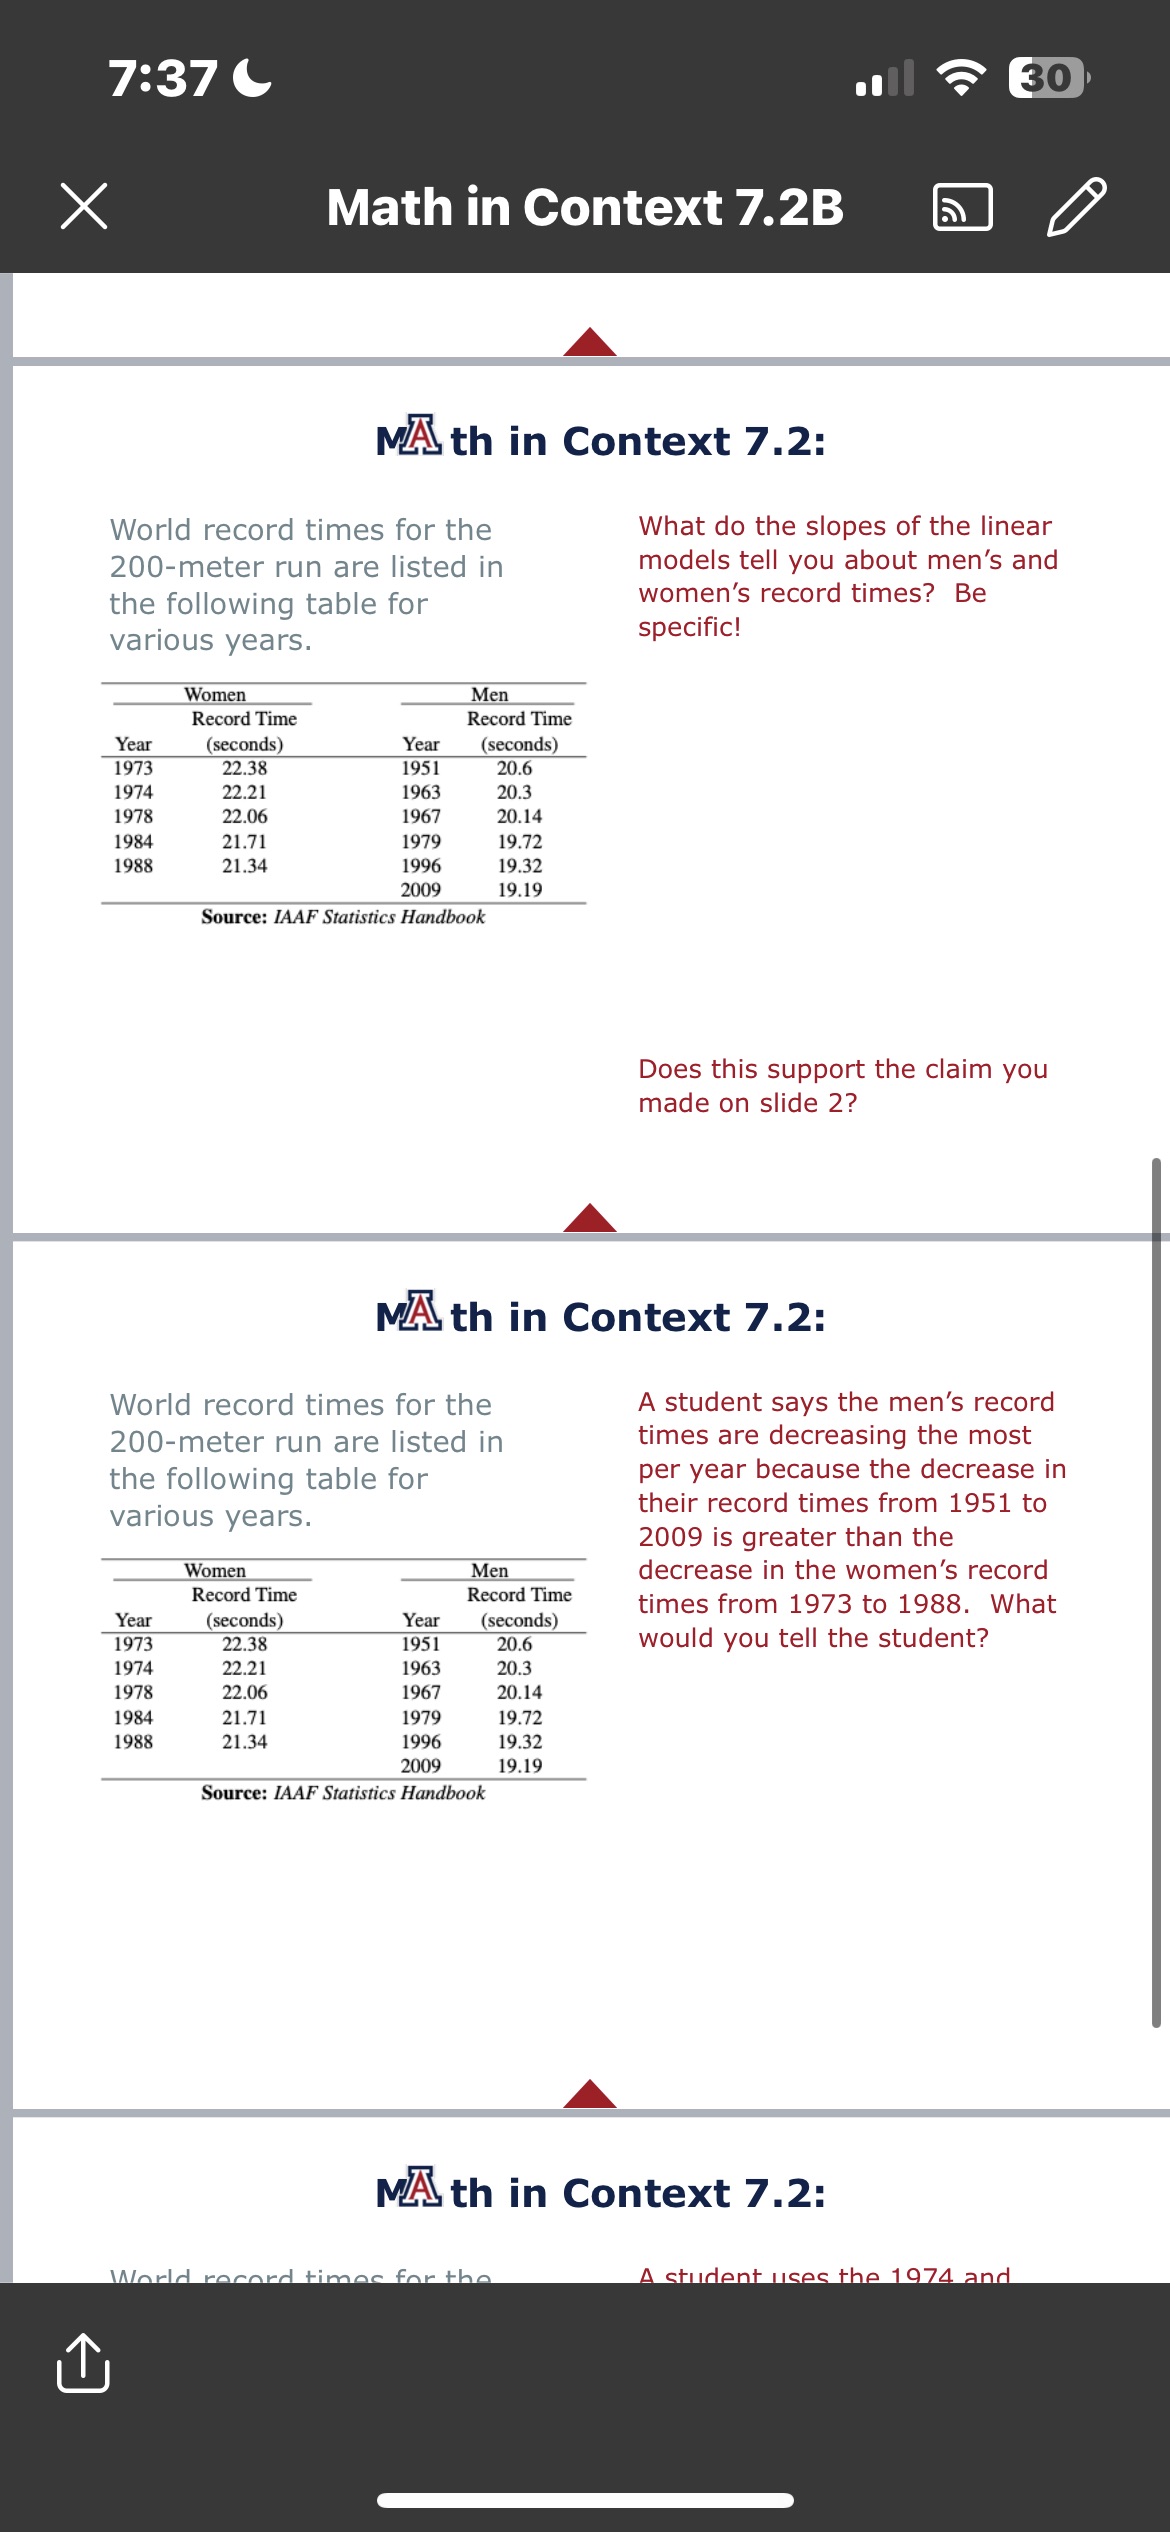
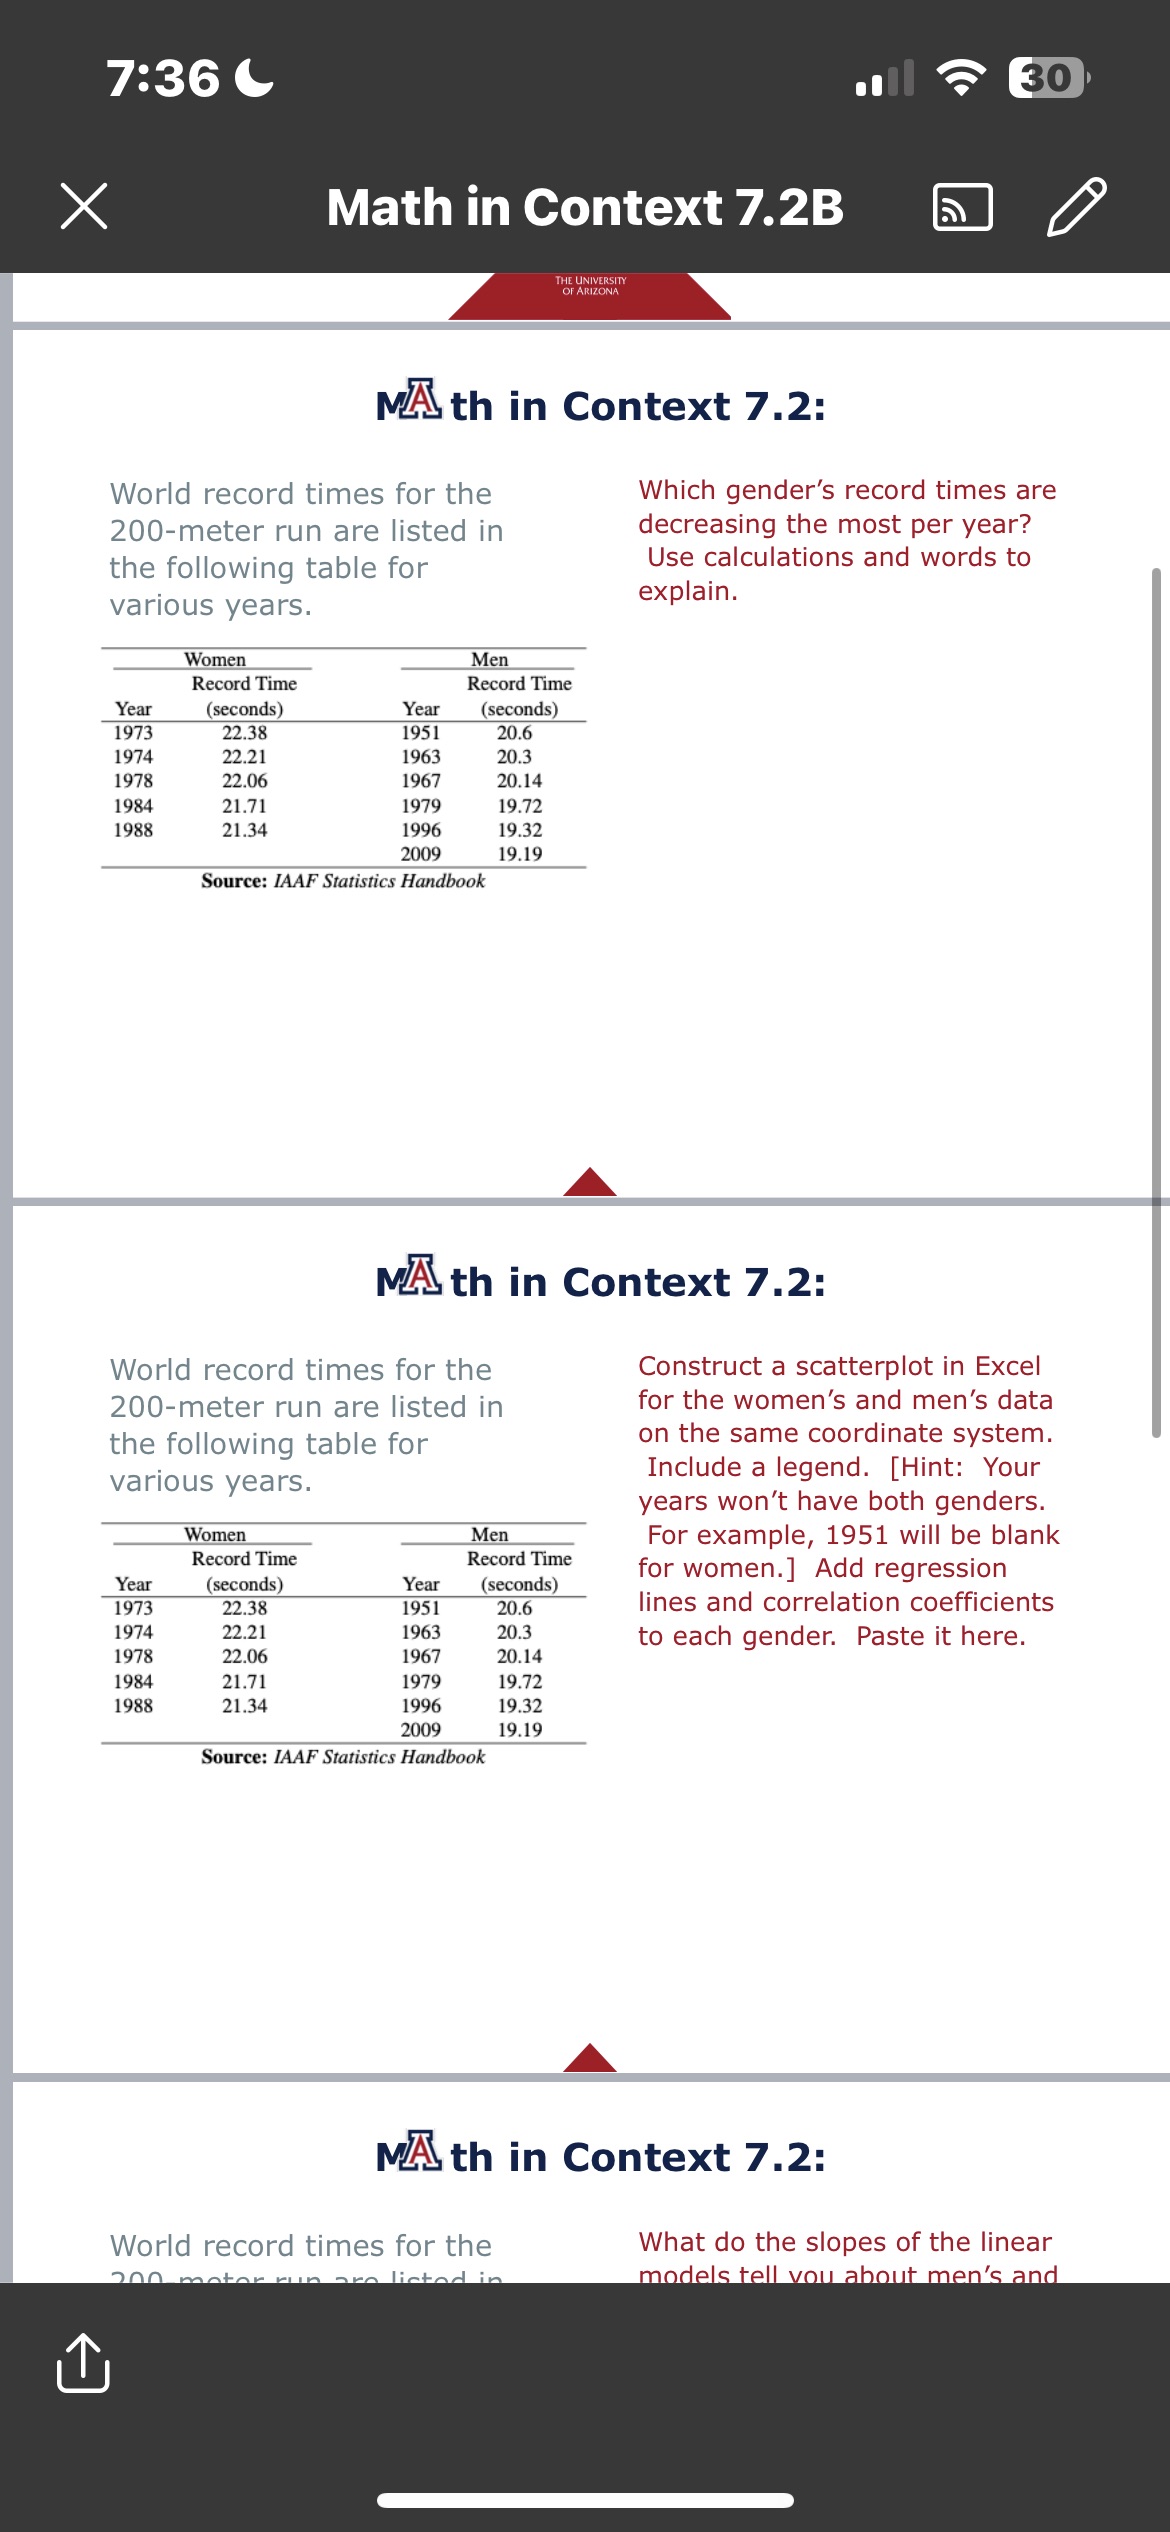
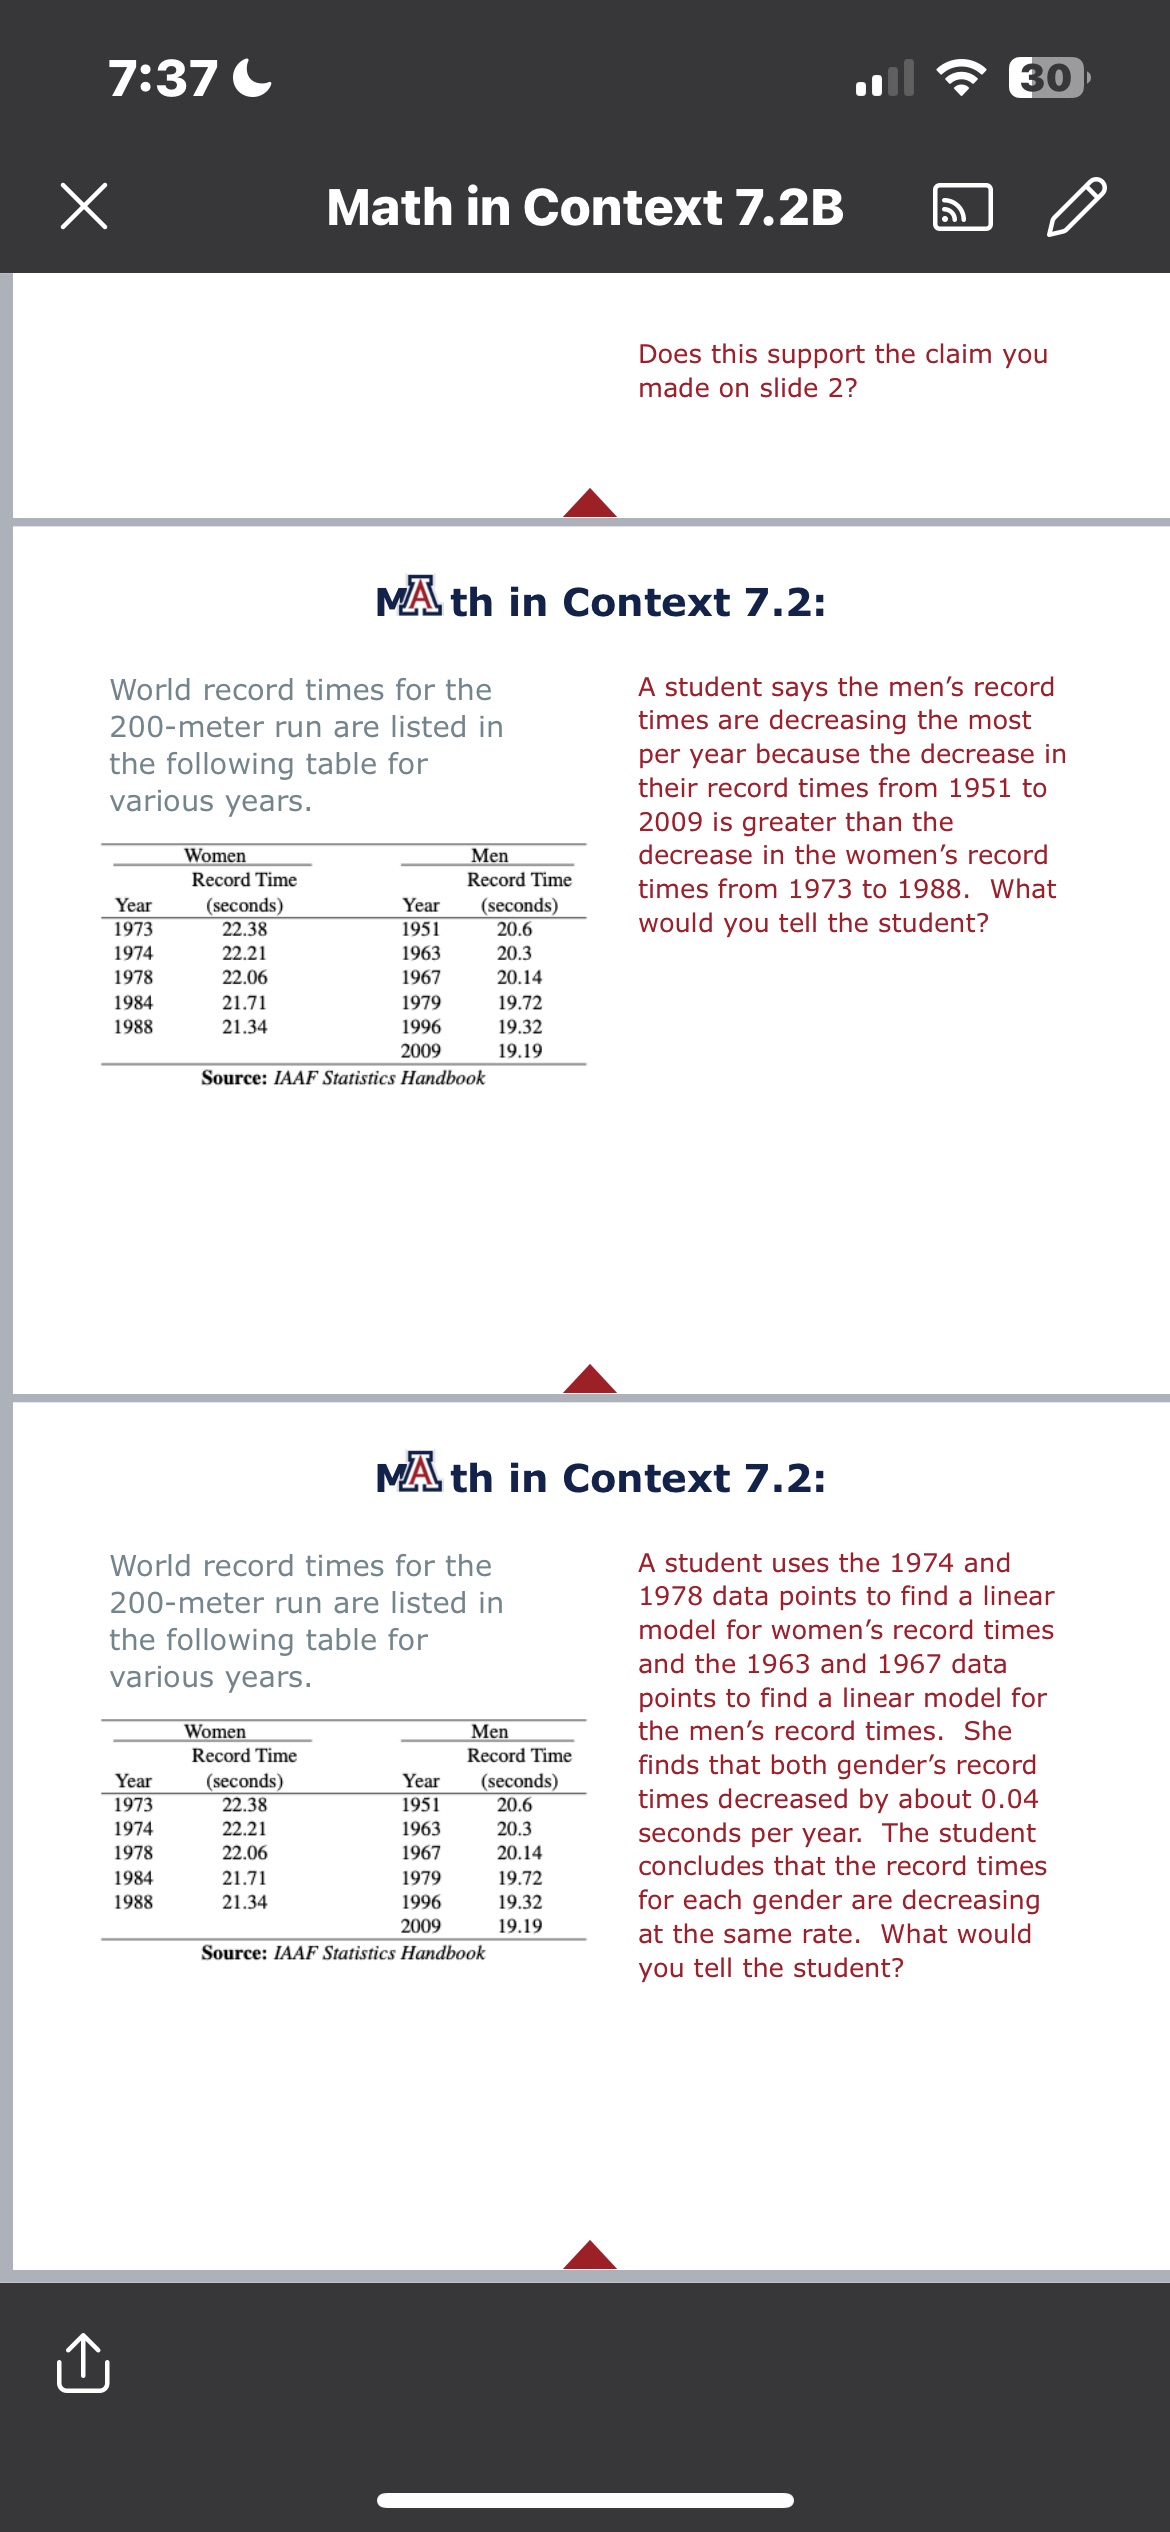
7:37 C 30 X Math in Context 7.2B 5) MA th in Context 7.2: World record times for the What do the slopes of the linear 200-meter run are listed in models tell you about men's and the following table for women's record times? Be various years. specific! Women Men Record Time Record Time Year (seconds) Year (seconds) 1973 22.38 195 20.6 1974 22.21 1963 20.3 1978 22.06 1967 20.14 1984 21.71 1979 19.72 1988 21.34 1996 19.32 2009 19.19 Source: IAAF Statistics Handbook Does this support the claim you made on slide 2? MA th in Context 7.2: World record times for the A student says the men's record 200-meter run are listed in times are decreasing the most the following table for per year because the decrease in various years. their record times from 1951 to 2009 is greater than the Women Men decrease in the women's record Record Time Record Time Year (seconds) Year (seconds) times from 1973 to 1988. What 1973 22.38 1951 20.6 would you tell the student? 1974 22.21 1963 20.3 1978 22.06 1967 20.14 1984 21.71 979 19.72 1988 21.34 1996 19.32 2009 19.19 Source: IAAF Statistics Handbook MA th in Context 7.2: World record times for A student uses the 1974 and7:36 4 30 X Math in Context 7.2B 5) To ARIZONA MA th in Context 7.2: World record times for the Which gender's record times are 200-meter run are listed in decreasing the most per year? the following table for Use calculations and words to various years. explain. Women Men Record Time Record Time Year (seconds) Year (seconds) 1973 22.38 1951 20.6 1974 22.21 1963 20.3 1978 22.06 1967 20.14 1984 21.71 1979 19.72 1988 21.34 1996 19.32 2009 19.19 Source: IAAF Statistics Handbook MA th in Context 7.2: World record times for the Construct a scatterplot in Excel 200-meter run are listed in for the women's and men's data the following table for on the same coordinate system. various years. Include a legend. [Hint: Your years won't have both genders. Women Men For example, 1951 will be blank Record Time Record Time Year (seconds) Year (seconds) for women.] Add regression 1973 22.38 1951 20.6 lines and correlation coefficients 1974 22.21 1963 20.3 to each gender. Paste it here. 1978 22.06 1967 20.14 1984 21.71 1979 19.72 1988 21.34 1996 19.32 2009 19.19 Source: IAAF Statistics Handbook MA th in Context 7.2: World record times for the What do the slopes of the linear ann motor an listed in models tell you about men's andMath in Context 7.23 Does this support the claim you made on slide 2? A MA th in Context 7.2: A student says the men's record times are decreasing the most per year because the decrease in their record times from 1951 to 2009 is greater than the decrease in the women's record times from 1973 to 1988. What World record times for the ZOOmeter run are listed in the following table for various years. Wome n Men Record Time Record Time Year seconds Year secnnds 1973 ( 2233 ) 1951 ( 201, ) Would YOU tell the Student? 1974 22.21 1963 20.3 1978 22.06 1967 20.14 1934 21.71 1979 19.72 1983 21.34 1996 19.32 _2_(_J_09 19.19 'S'ource: IMFStan'sc's HandBaotk A NA th in Context 7.2: World record times for the ZOOmeter run are listed in the following table for various years. Women Men Record Time Record Time Ye 31' (seconds) Year (seconds) 1973 22.33 195] 205 1974 22.21 1963 20.3 1978 22.06 1967 20, ] 4 1984 21.71 1979 19.72 1988 21.34 1996 19.32 2009 19.19 Source: IAAF Srau'm'cs Handbook A student uses the 1974 and 1978 data points to find a linear model for women's record times and the 1963 and 1967 data points to find a linear model for the men's record times. She finds that both gender's record times decreased by about 0.04 seconds per year. The student concludes that the record times for each gender are decreasing at the same rate. What would you tell the student
Step by Step Solution
There are 3 Steps involved in it

Get step-by-step solutions from verified subject matter experts