

Question: 8 . 3 : Histogram Design and implement an application that creates a histogram that allows you to visually inspect the frequency distribution of a
: Histogram
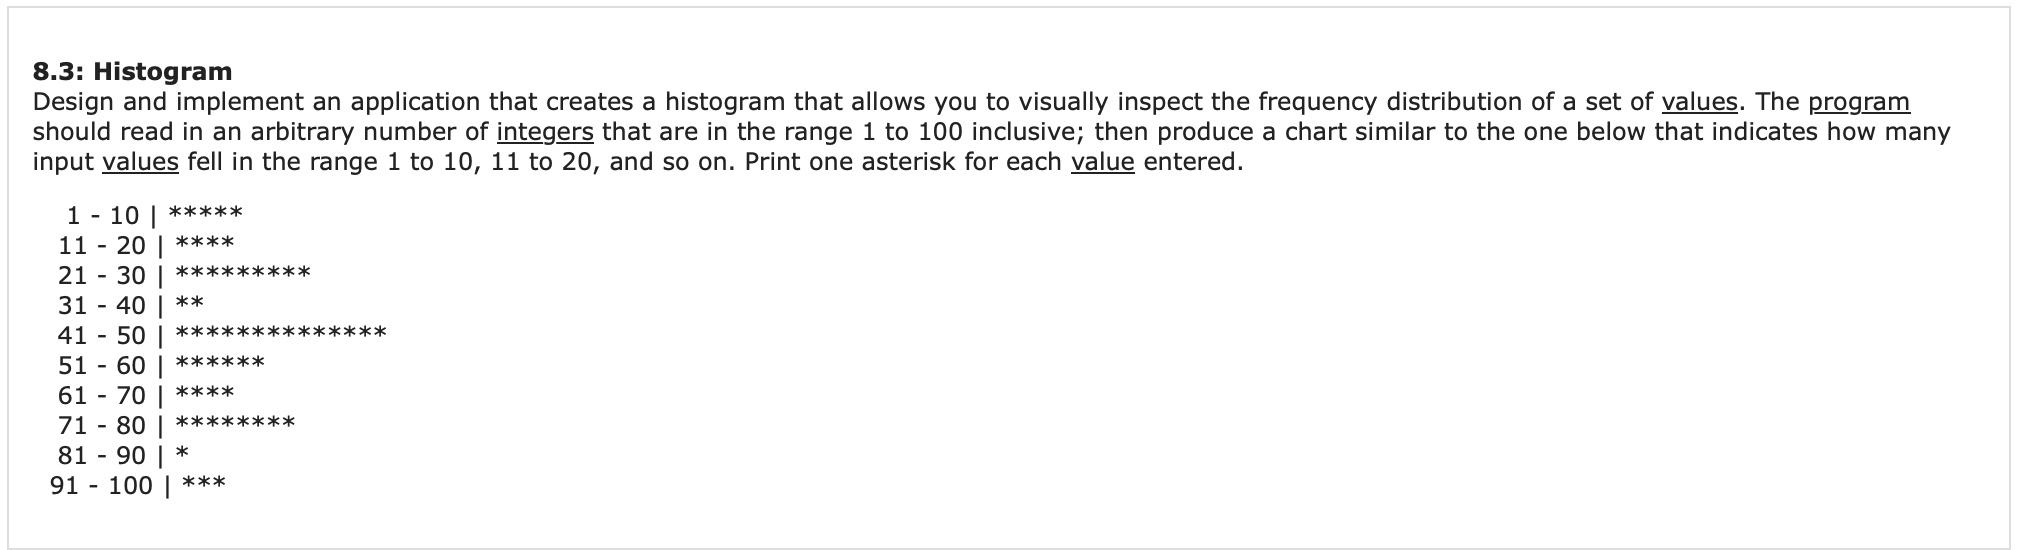
Design and implement an application that creates a histogram that allows you to visually inspect the frequency distribution of a set of values. The program should read in an arbitrary number of integers that are in the range to inclusive; then produce a chart similar to the one below that indicates how many input values fell in the range to to and so on Print one asterisk for each value entered.
Java
Step by Step Solution
There are 3 Steps involved in it
1 Expert Approved Answer
Step: 1 Unlock

Question Has Been Solved by an Expert!
Get step-by-step solutions from verified subject matter experts
Step: 2 Unlock
Step: 3 Unlock