

Question: ***** 8.3: Histogram Design and implement an application that creates a histogram that allows you to visually inspect the frequency distribution of a set of
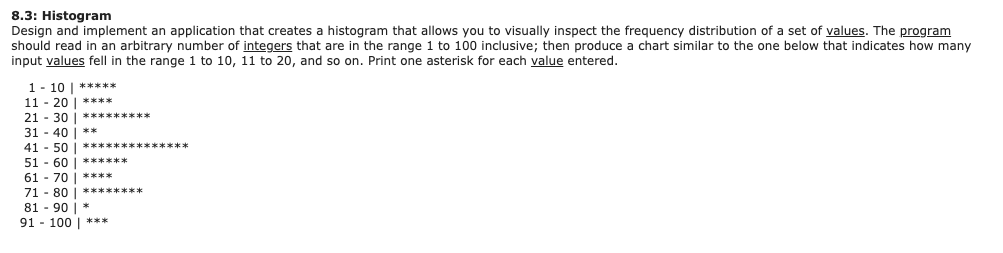
***** 8.3: Histogram Design and implement an application that creates a histogram that allows you to visually inspect the frequency distribution of a set of values. The program should read in an arbitrary number of integers that are in the range 1 to 100 inclusive; then produce a chart similar to the one below that indicates how many input values fell in the range 1 to 10, 11 to 20, and so on. Print one asterisk for each value entered. 1 - 10 11 - 20 21 - 30 31 - 40 41 - 50 51 - 60 61 - 70 71 - 80 81 - 90 * 91 - 100 *** ***** 8.3: Histogram Design and implement an application that creates a histogram that allows you to visually inspect the frequency distribution of a set of values. The program should read in an arbitrary number of integers that are in the range 1 to 100 inclusive; then produce a chart similar to the one below that indicates how many input values fell in the range 1 to 10, 11 to 20, and so on. Print one asterisk for each value entered. 1 - 10 11 - 20 21 - 30 31 - 40 41 - 50 51 - 60 61 - 70 71 - 80 81 - 90 * 91 - 100 ***
Step by Step Solution
There are 3 Steps involved in it

Get step-by-step solutions from verified subject matter experts