

Question: ***** 8.3: Histogram Design and implement an application that creates a histogram that allows you to visually inspect the frequency distribution of a set of
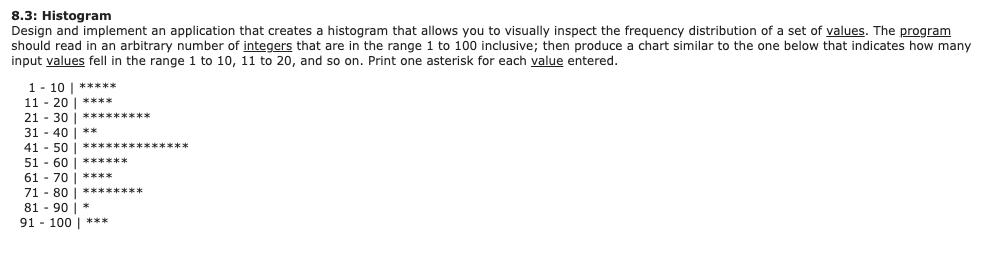
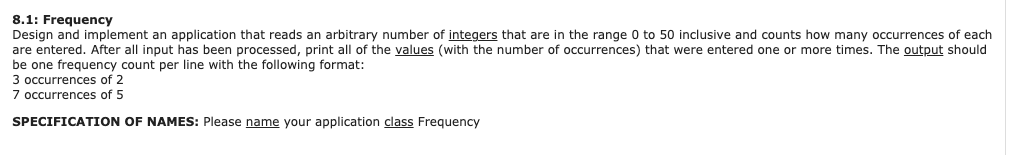

***** 8.3: Histogram Design and implement an application that creates a histogram that allows you to visually inspect the frequency distribution of a set of values. The program should read in an arbitrary number of integers that are in the range 1 to 100 inclusive; then produce a chart similar to the one below that indicates how many input values fell in the range 1 to 10, 11 to 20, and so on. Print one asterisk for each value entered. 1 - 10 11 - 20 21 - 30 31 - 40 41 - 50 51 - 60 61 - 70 71 - 80 81 - 90 * 91 - 100 *** 8.1: Frequency Design and implement an application that reads an arbitrary number of integers that are in the range 0 to 50 inclusive and counts how many occurrences of each are entered. After all input has been processed, print all of the values with the number of occurrences) that were entered one or more times. The output should be one frequency count per line with the following format: 3 occurrences of 2 7 occurrences of 5 SPECIFICATION OF NAMES: Please name your application class Frequency 8.10: Quiz Use the Question class from Chapter 7 to define a Quiz class. A quiz can be composed of up to 25 questions. Define the add method of the Quiz class to add a question to a quiz. Define the giveQuiz method of the Quiz class to present each question in turn to the user, accept an answer for each one, and keep track of the results
Step by Step Solution
There are 3 Steps involved in it

Get step-by-step solutions from verified subject matter experts