

Question: 8. Figure 1 shows two sets of atomic force microscopy (AFM) images obtained from the same area of a poly(3,4-ethylenedioxythiophene) polystyrene polystyrene sulfonate (PEDOT:PSS) Lycra
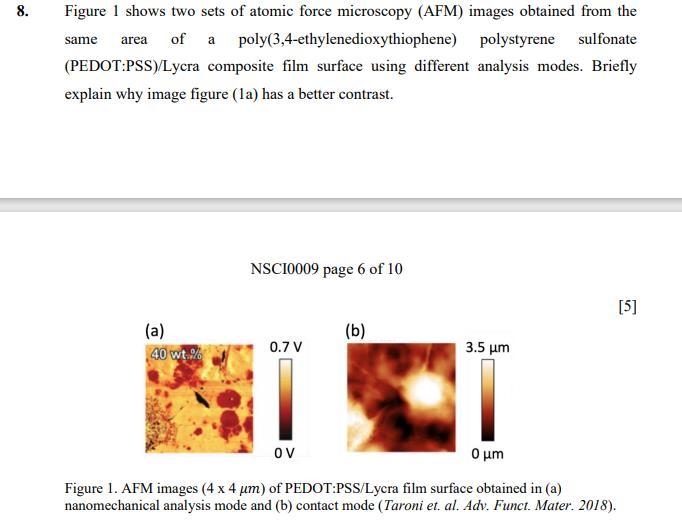
8. Figure 1 shows two sets of atomic force microscopy (AFM) images obtained from the same area of a poly(3,4-ethylenedioxythiophene) polystyrene polystyrene sulfonate (PEDOT:PSS) Lycra composite film surface using different analysis modes. Briefly explain why image figure (1a) has a better contrast. NSCI0009 page 6 of 10 [5] (a) (b) 40 wt. 0.7 V 3.5 um ov m Figure 1. AFM images (4 x 4 um) of PEDOT:PSS/Lycra film surface obtained in (a) nanomechanical analysis mode and (b) contact mode (Taroni et. al. Adv. Funct. Mater. 2018)
Step by Step Solution
There are 3 Steps involved in it
1 Expert Approved Answer
Step: 1 Unlock

Question Has Been Solved by an Expert!
Get step-by-step solutions from verified subject matter experts
Step: 2 Unlock
Step: 3 Unlock