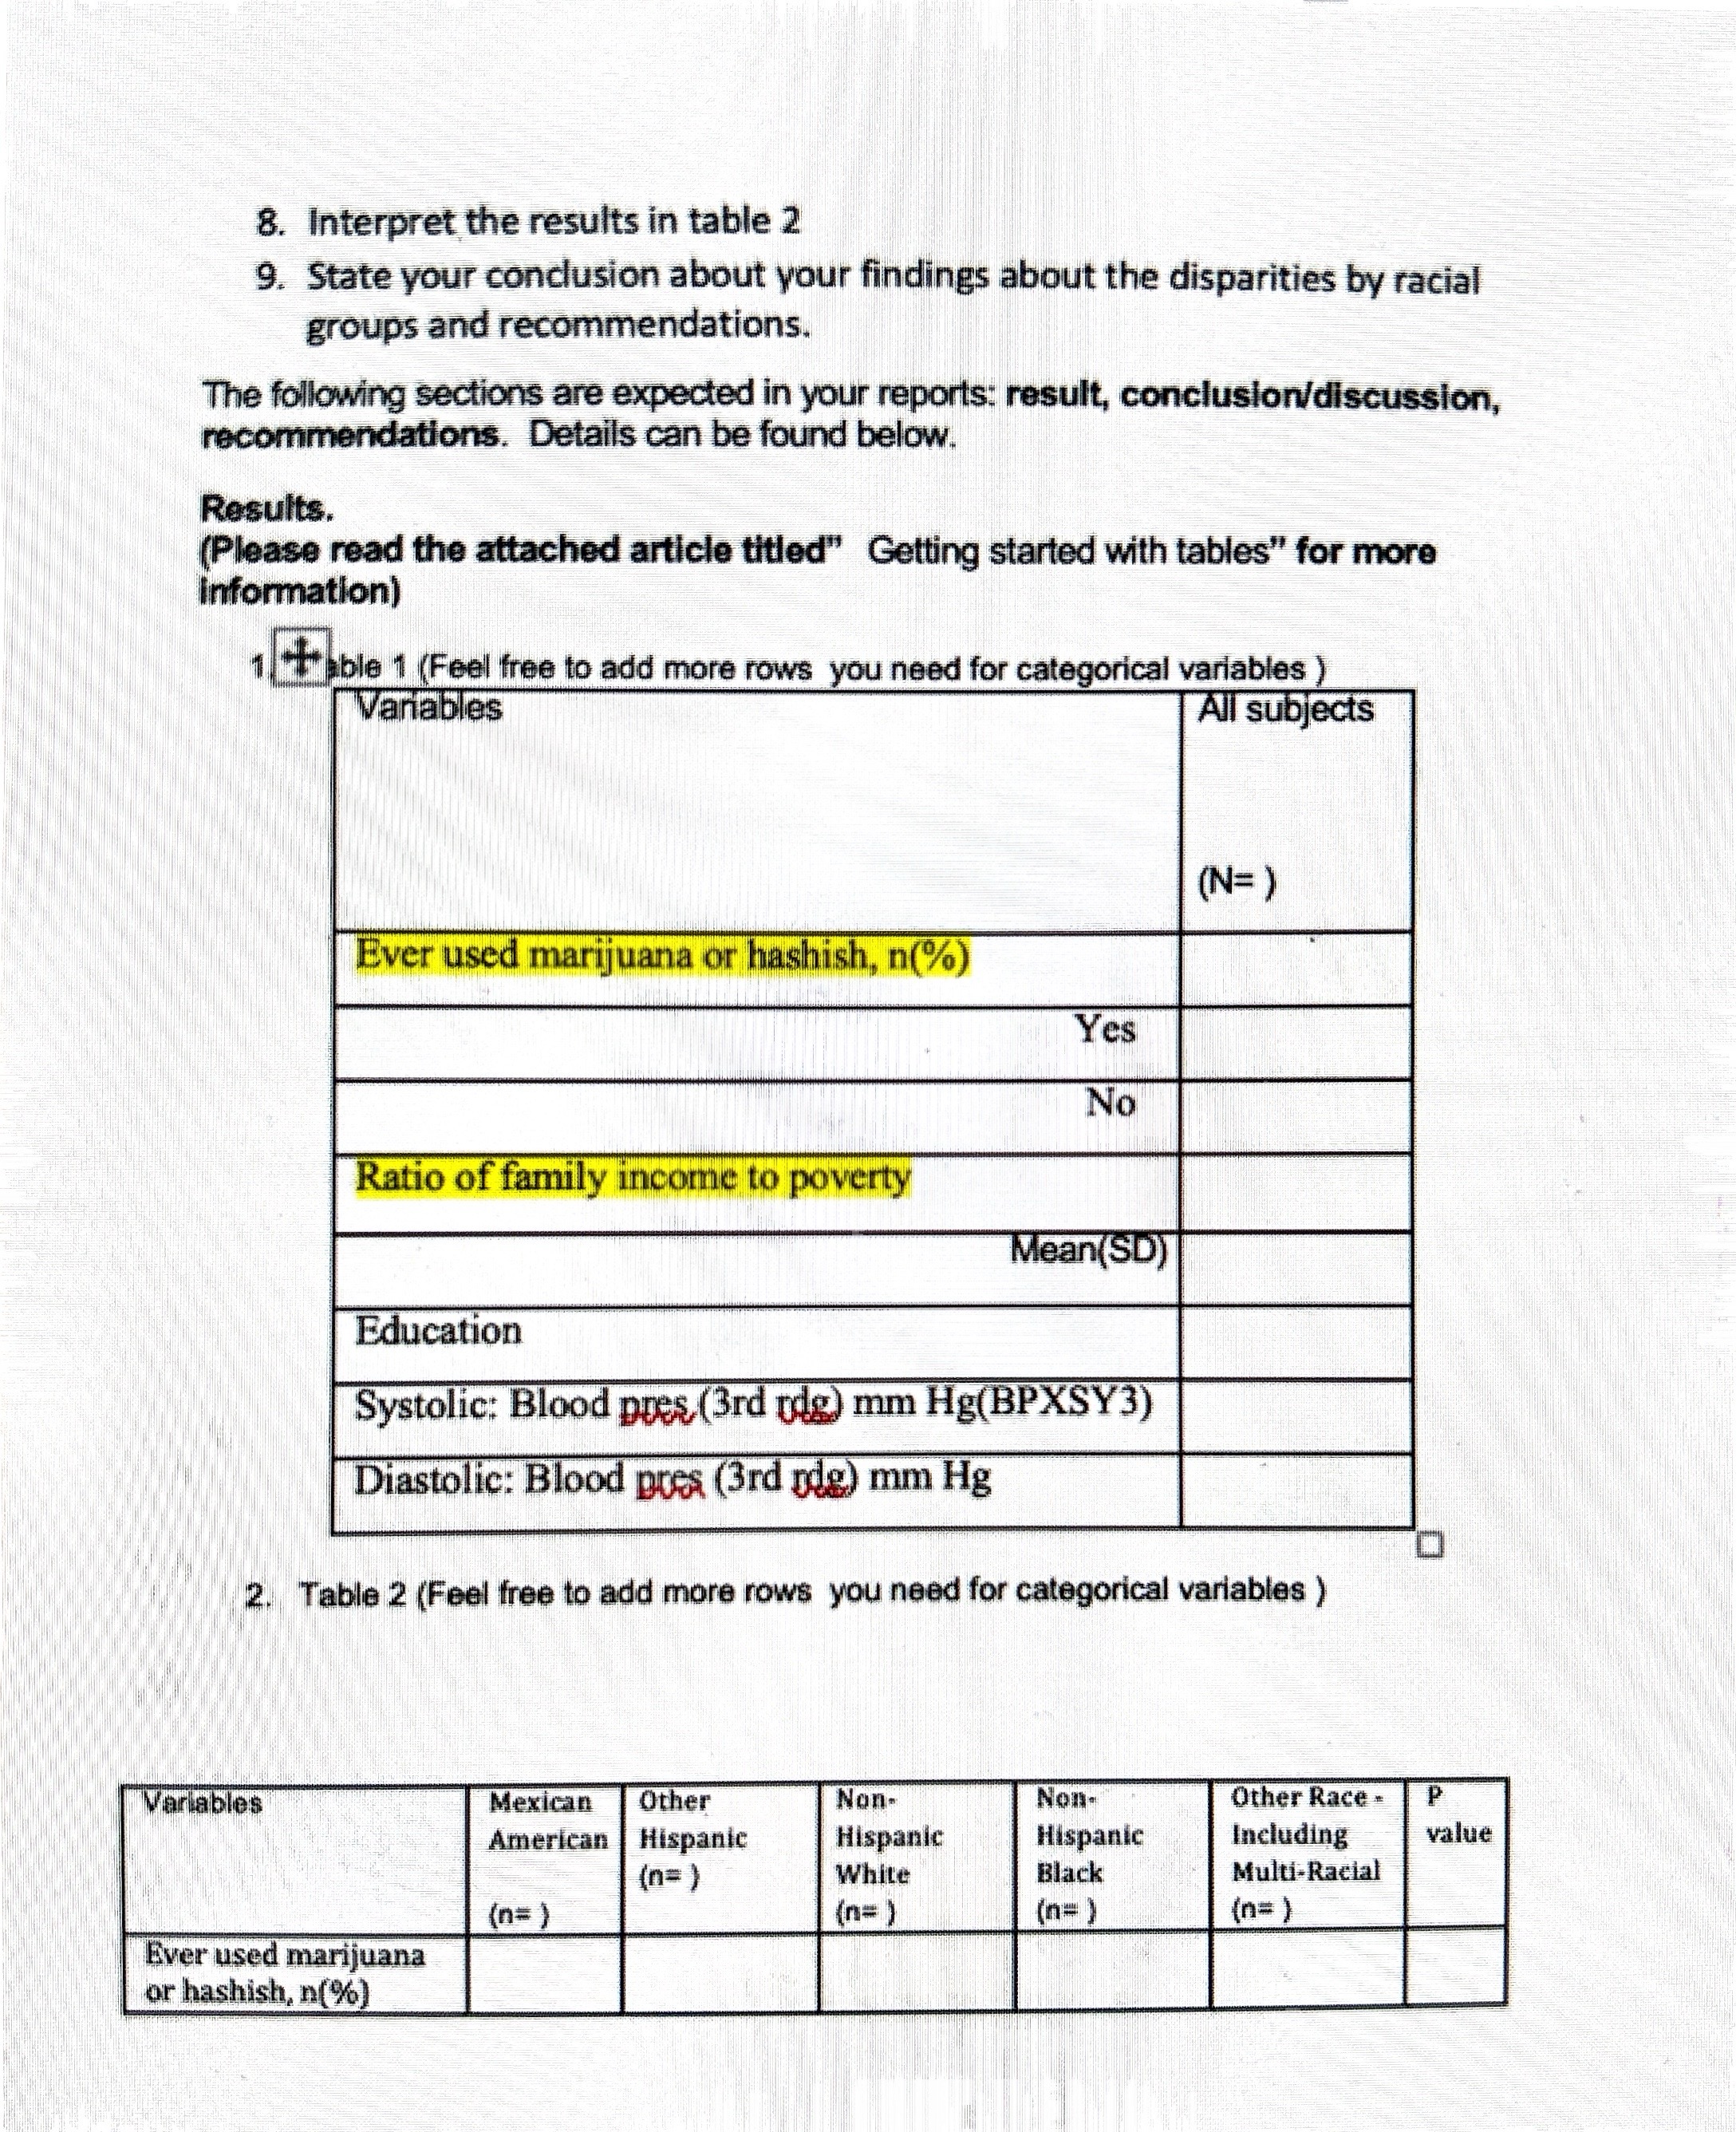
Question: 8. Interpret the results in table 2 9. State your conclusion about your findings about the disparities by racial groups and recommendations. The following sections

8. Interpret the results in table 2 9. State your8. Interpret the results in table 2 9. State your8. Interpret the results in table 2 9. State your
8. Interpret the results in table 2 9. State your conclusion about your findings about the disparities by racial groups and recommendations. The following sections are expected in your reports: result, conclusion/discussion, recommendations. Details can be found below. Results. (Please read the attached article titled" Getting started with tables" for more information) 1Table 1 (Feel free to add more rows you need for categorical variables ) Variables All subjects (N= ) Ever used marijuana or hashish, n(%) Yes No Ratio of family income to poverty Mean(SD) Education Systolic: Blood pres (3rd odg) mm Hg(BPXSY3) Diastolic: Blood poes (3rd gde) mm Hg 2. Table 2 (Feel free to add more rows you need for categorical variables ) Variables Mexican Other Non- Non- Other Race - American | Hispanic Hispanic Hispanic Including value (n=) White Black Multi-Racial (n=) (n= (n= ) ( n = ) Ever used marijuana or hashish, n(%)Yes No Ratio of family income to poverty Mean(SD) Systolic: Blood pres. (3rd rdg) mm Hg(BPXSY3) Diastolic: Blood pres. 3rd odg) mm Hg Education Grade and score sheet The Grading sheet is listed below as well as the rubric Sections Points available | Points earned | Comments CITI training certificate (Bonus) 10(Bonus) Completeness 40 Accuracy 20 Cohesiveness 15 Depth Discussion 15 Spelling and grammar Total LLOObjective: The primary objective of this asscssment is to provide students hand-on experience to apply statistical tests learned in the e:lassbymalymg NHANES data to examine the evidence in the data and make ate inference and conchusion based on the tests. Students will mhmnmmm descriptive analysis, analyzing, interpreting, and presenting epidemiologic data. They will analyze data and create tables to summarize the evidence and write the report to address the given research question. Purpose: The purpose of this project to examine the disparities by racial groups (RIDRETH1) from the following perspectives: 1) Education{ouszoucz), 2) Ratio of family income to poverty (1xosueir), 3) Ewver used marijuana or hashish(DUQ200), 4) Systolic: Blood pres (3rd rdg) mm Hg(BPXSY3), 5) Diastolic: Blood pres,(3rd glg) mm Hg(BPXDI3) Guidelines are as followed: 1. [Finish CITI training and submit CITI certificate (Required for MPH students, and who ever is finished will eam Bonus 10 points for the project) 2. Download the SAS dataset named nh1516project] and use it to finish the final report. 3. Check the dictionary (https://wwwn.cde govchshanes/search/default.aspx) and identify data type(continuous vs Categorical variable) for each variable 4. Run appropriate SAS codes to summarize each variable based on their data type appropriately and fill those numerical summaries table 1. (Table 1 shell below showed an example for a continuous variable and a categorical variable, respectively) 5. Interpret the results in table 1 ~b. Run appropriate SAS codes to summarize each variable appropriately by i racial groups and fill those numerical summaries table 2. 7. Run appropriate Statistical tests to examine whether there are means or the proportions differences for each variable by racial variable, respectively and add p values into the table 2 - ES

Step by Step Solution

There are 3 Steps involved in it

1 Expert Approved Answer
Step: 1 Unlock blur-text-image
Question Has Been Solved by an Expert!

Get step-by-step solutions from verified subject matter experts

Step: 2 Unlock
Step: 3 Unlock

Students Have Also Explored These Related Mathematics Questions!