

Question: 8 Refer to Table 561 - Factors for Computing Control Chart Limits. (3 sigma) for this problem. Thirty-five samples of size 7 each were taken
8 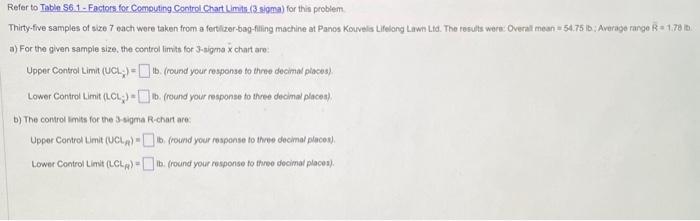
Refer to Table 561 - Factors for Computing Control Chart Limits. (3 sigma) for this problem. Thirty-five samples of size 7 each were taken from a fertilizer-bag-filing machine at Panos Kouvelis Lifeliong Lawn Lid. The rosults were: Overall mean = 54.75 lo: Average range R = 1.78 it. a) For the given sample size, the control limits for 3-sigms x chart are: Upper Control Limit ( UCl- )= Ib. (round your response to three decimal places). Lower Control Limit (L2L)= Bb. (round your response to three decimal places). b) The control inits for the 3-sigma R-chart are: Upper Control timit (UCLP)= to, (round your respense to theee decimal places). Lower Control Limit (LLLR)= It. (round your response to three docimal places) Step by Step Solution
There are 3 Steps involved in it
1 Expert Approved Answer
Step: 1 Unlock

Question Has Been Solved by an Expert!
Get step-by-step solutions from verified subject matter experts
Step: 2 Unlock
Step: 3 Unlock