

Question: 8. The bar graph below shows that as costs changed over the decades, Americans devoted less of their budget to groceries and more to health
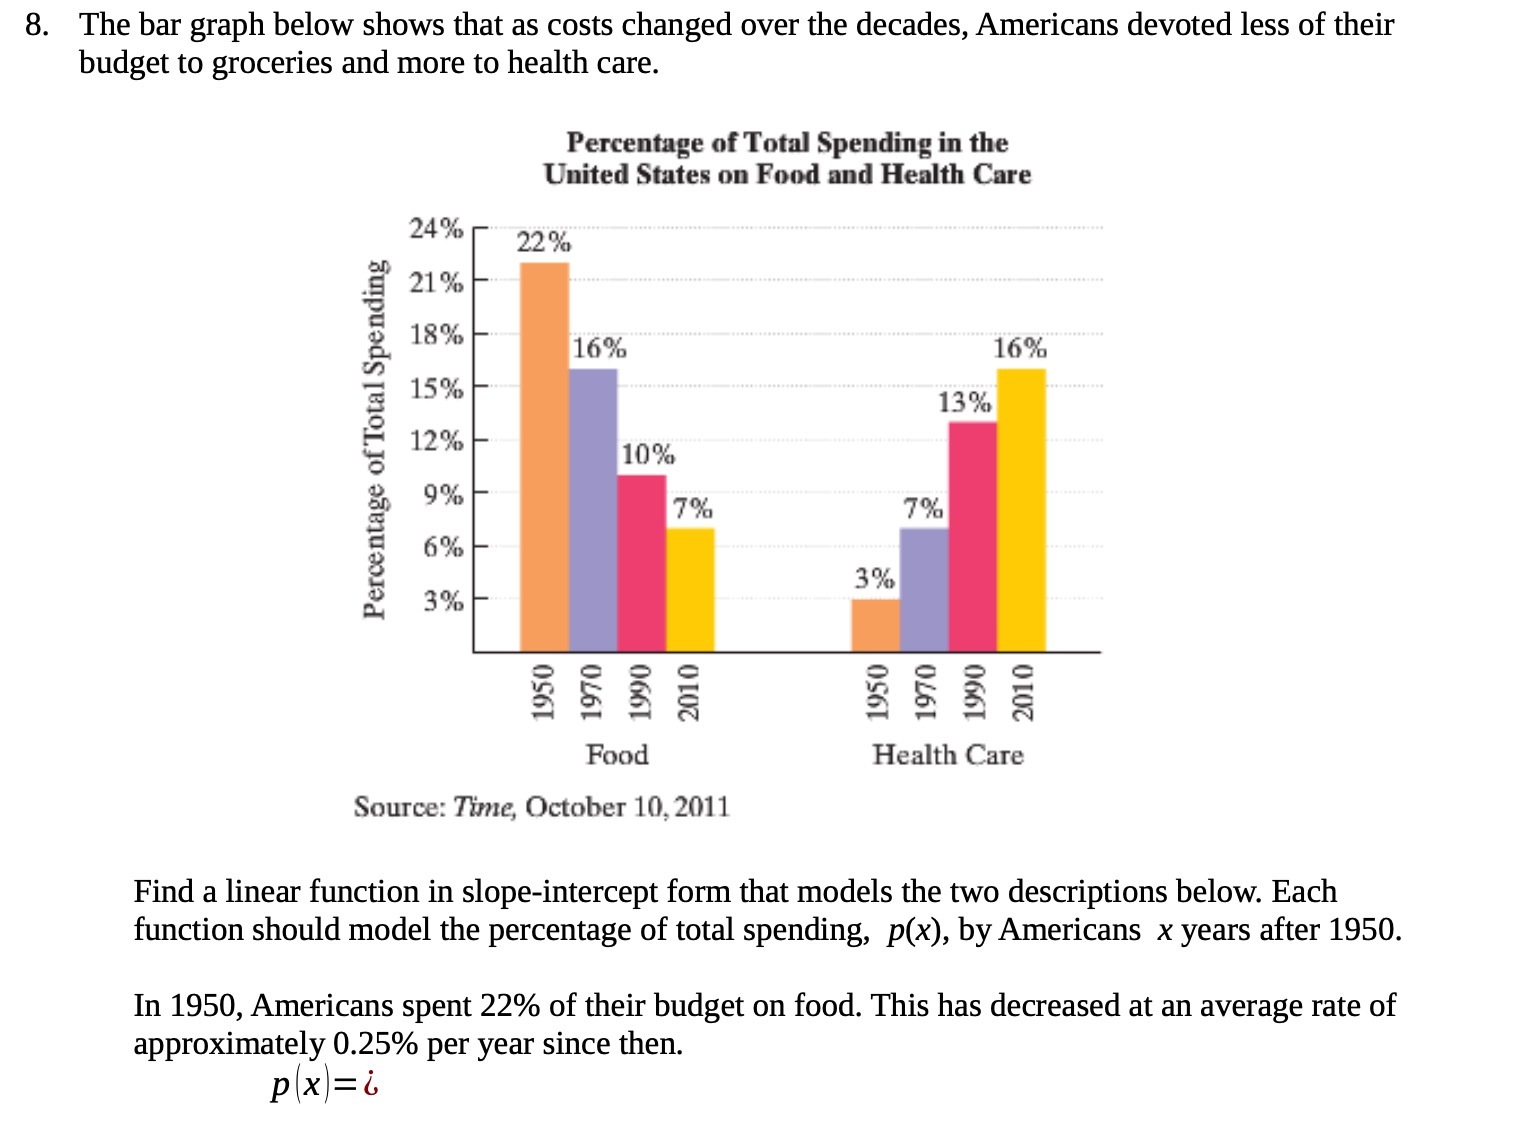
8. The bar graph below shows that as costs changed over the decades, Americans devoted less of their budget to groceries and more to health care. Percenuge of Total Spending in the United Siltel on Food Illl Health Cute 21% 18% G a? 12% so 32 Percentage of Total Spending a. a? u: a2 Source: Me, October 10,2011 Find a linear function in slope-intercept form that models the two descriptions below. Each function should model the percentage of total spending, p(x), by Americans x years after 1950. In 1950, Americans spent 22% of their budget on food. This has decreased at an average rate of approximately 0.25% per year since then. p (x ) = 6
Step by Step Solution
There are 3 Steps involved in it

Get step-by-step solutions from verified subject matter experts