

Question: 8.1 The following table shows the data calculated in a risk study for assessing the risk of a liquefied natural gas (LNG) terminal: a. Based
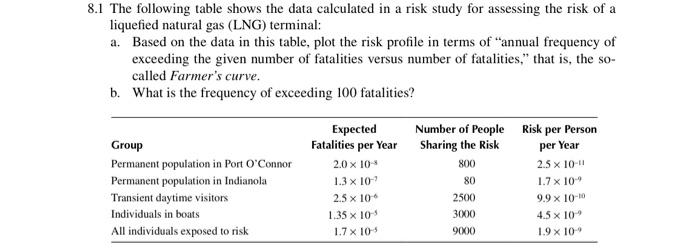
8.1 The following table shows the data calculated in a risk study for assessing the risk of a liquefied natural gas (LNG) terminal: a. Based on the data in this table, plot the risk profile in terms of "annual frequency of exceeding the given number of fatalities versus number of fatalities," that is, the socalled Farmer's curve. b. What is the frequency of exceeding 100 fatalities
Step by Step Solution
There are 3 Steps involved in it
1 Expert Approved Answer
Step: 1 Unlock

Question Has Been Solved by an Expert!
Get step-by-step solutions from verified subject matter experts
Step: 2 Unlock
Step: 3 Unlock