

Question: 9 . 1 . The data in Table 9 E . 1 represent individual observations on molecular weight taken hourly from a chemical process. Table
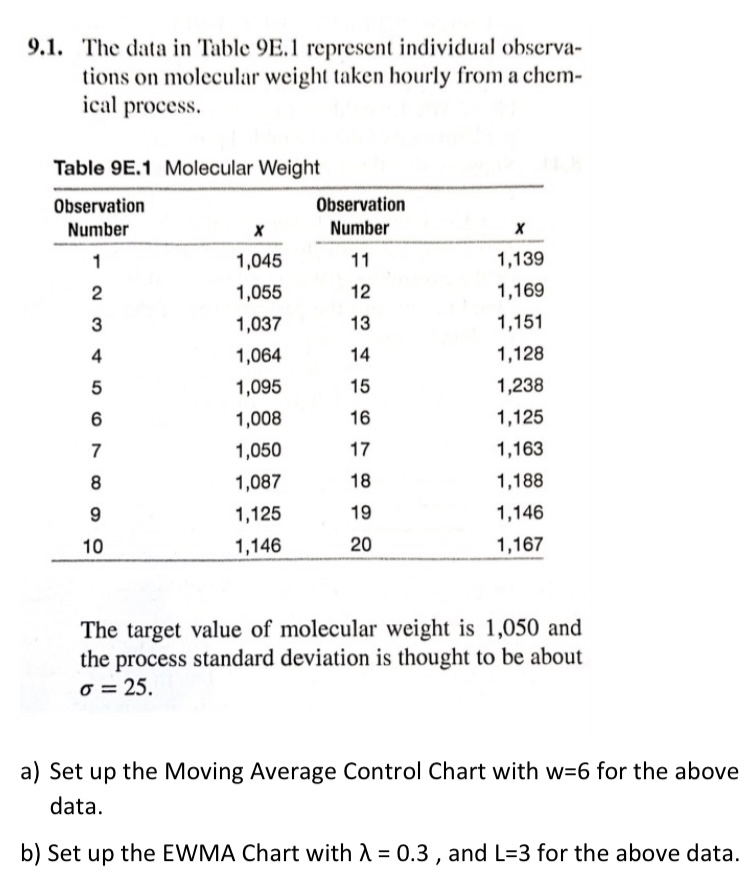
The data in Table E represent individual observations on molecular weight taken hourly from a chemical process.
Table E Molecular Weight
tabletableObservationNumbertableObservationNumber
The target value of molecular weight is and the process standard deviation is thought to be about
a Set up the Moving Average Control Chart with for the above data.
b Set up the EWMA Chart with and for the above data.
Step by Step Solution
There are 3 Steps involved in it
1 Expert Approved Answer
Step: 1 Unlock

Question Has Been Solved by an Expert!
Get step-by-step solutions from verified subject matter experts
Step: 2 Unlock
Step: 3 Unlock