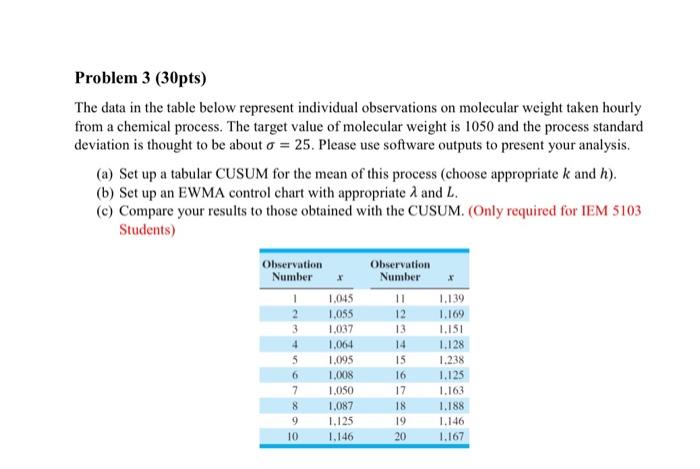
Question: Problem 3 (30pts) The data in the table below represent individual observations on molecular weight taken hourly from a chemical process. The target value of

Problem 3 (30pts) The data in the table below
Problem 3 (30pts) The data in the table below represent individual observations on molecular weight taken hourly from a chemical process. The target value of molecular weight is 1050 and the process standard deviation is thought to be about o = 25. Please use software outputs to present your analysis, (a) Set up a tabular CUSUM for the mean of this process (choose appropriate k and h). (b) Set up an EWMA control chart with appropriate 1 and L. (c) Compare your results to those obtained with the CUSUM. (Only required for IEM 5103 Students) . Observation Number 1 2 3 4 5 6 7 8 9 10 1.045 1.055 1,037 1.064 1.095 1,008 1,050 1.087 1.125 1.146 Observation Number 11 12 13 14 15 16 17 18 19 20 1.139 1.169 1.151 1.128 1.238 1.125 1.163 1.188 1.146 1.167

Step by Step Solution

There are 3 Steps involved in it

1 Expert Approved Answer
Step: 1 Unlock blur-text-image
Question Has Been Solved by an Expert!

Get step-by-step solutions from verified subject matter experts

Step: 2 Unlock
Step: 3 Unlock

Students Have Also Explored These Related General Management Questions!