

Question: CHAPTER 9 EXERCISES S$ 9.1. The data in Table 9E.1 represent individual observa- tions on molecular weight taken hourly from a chem- ical process. Table
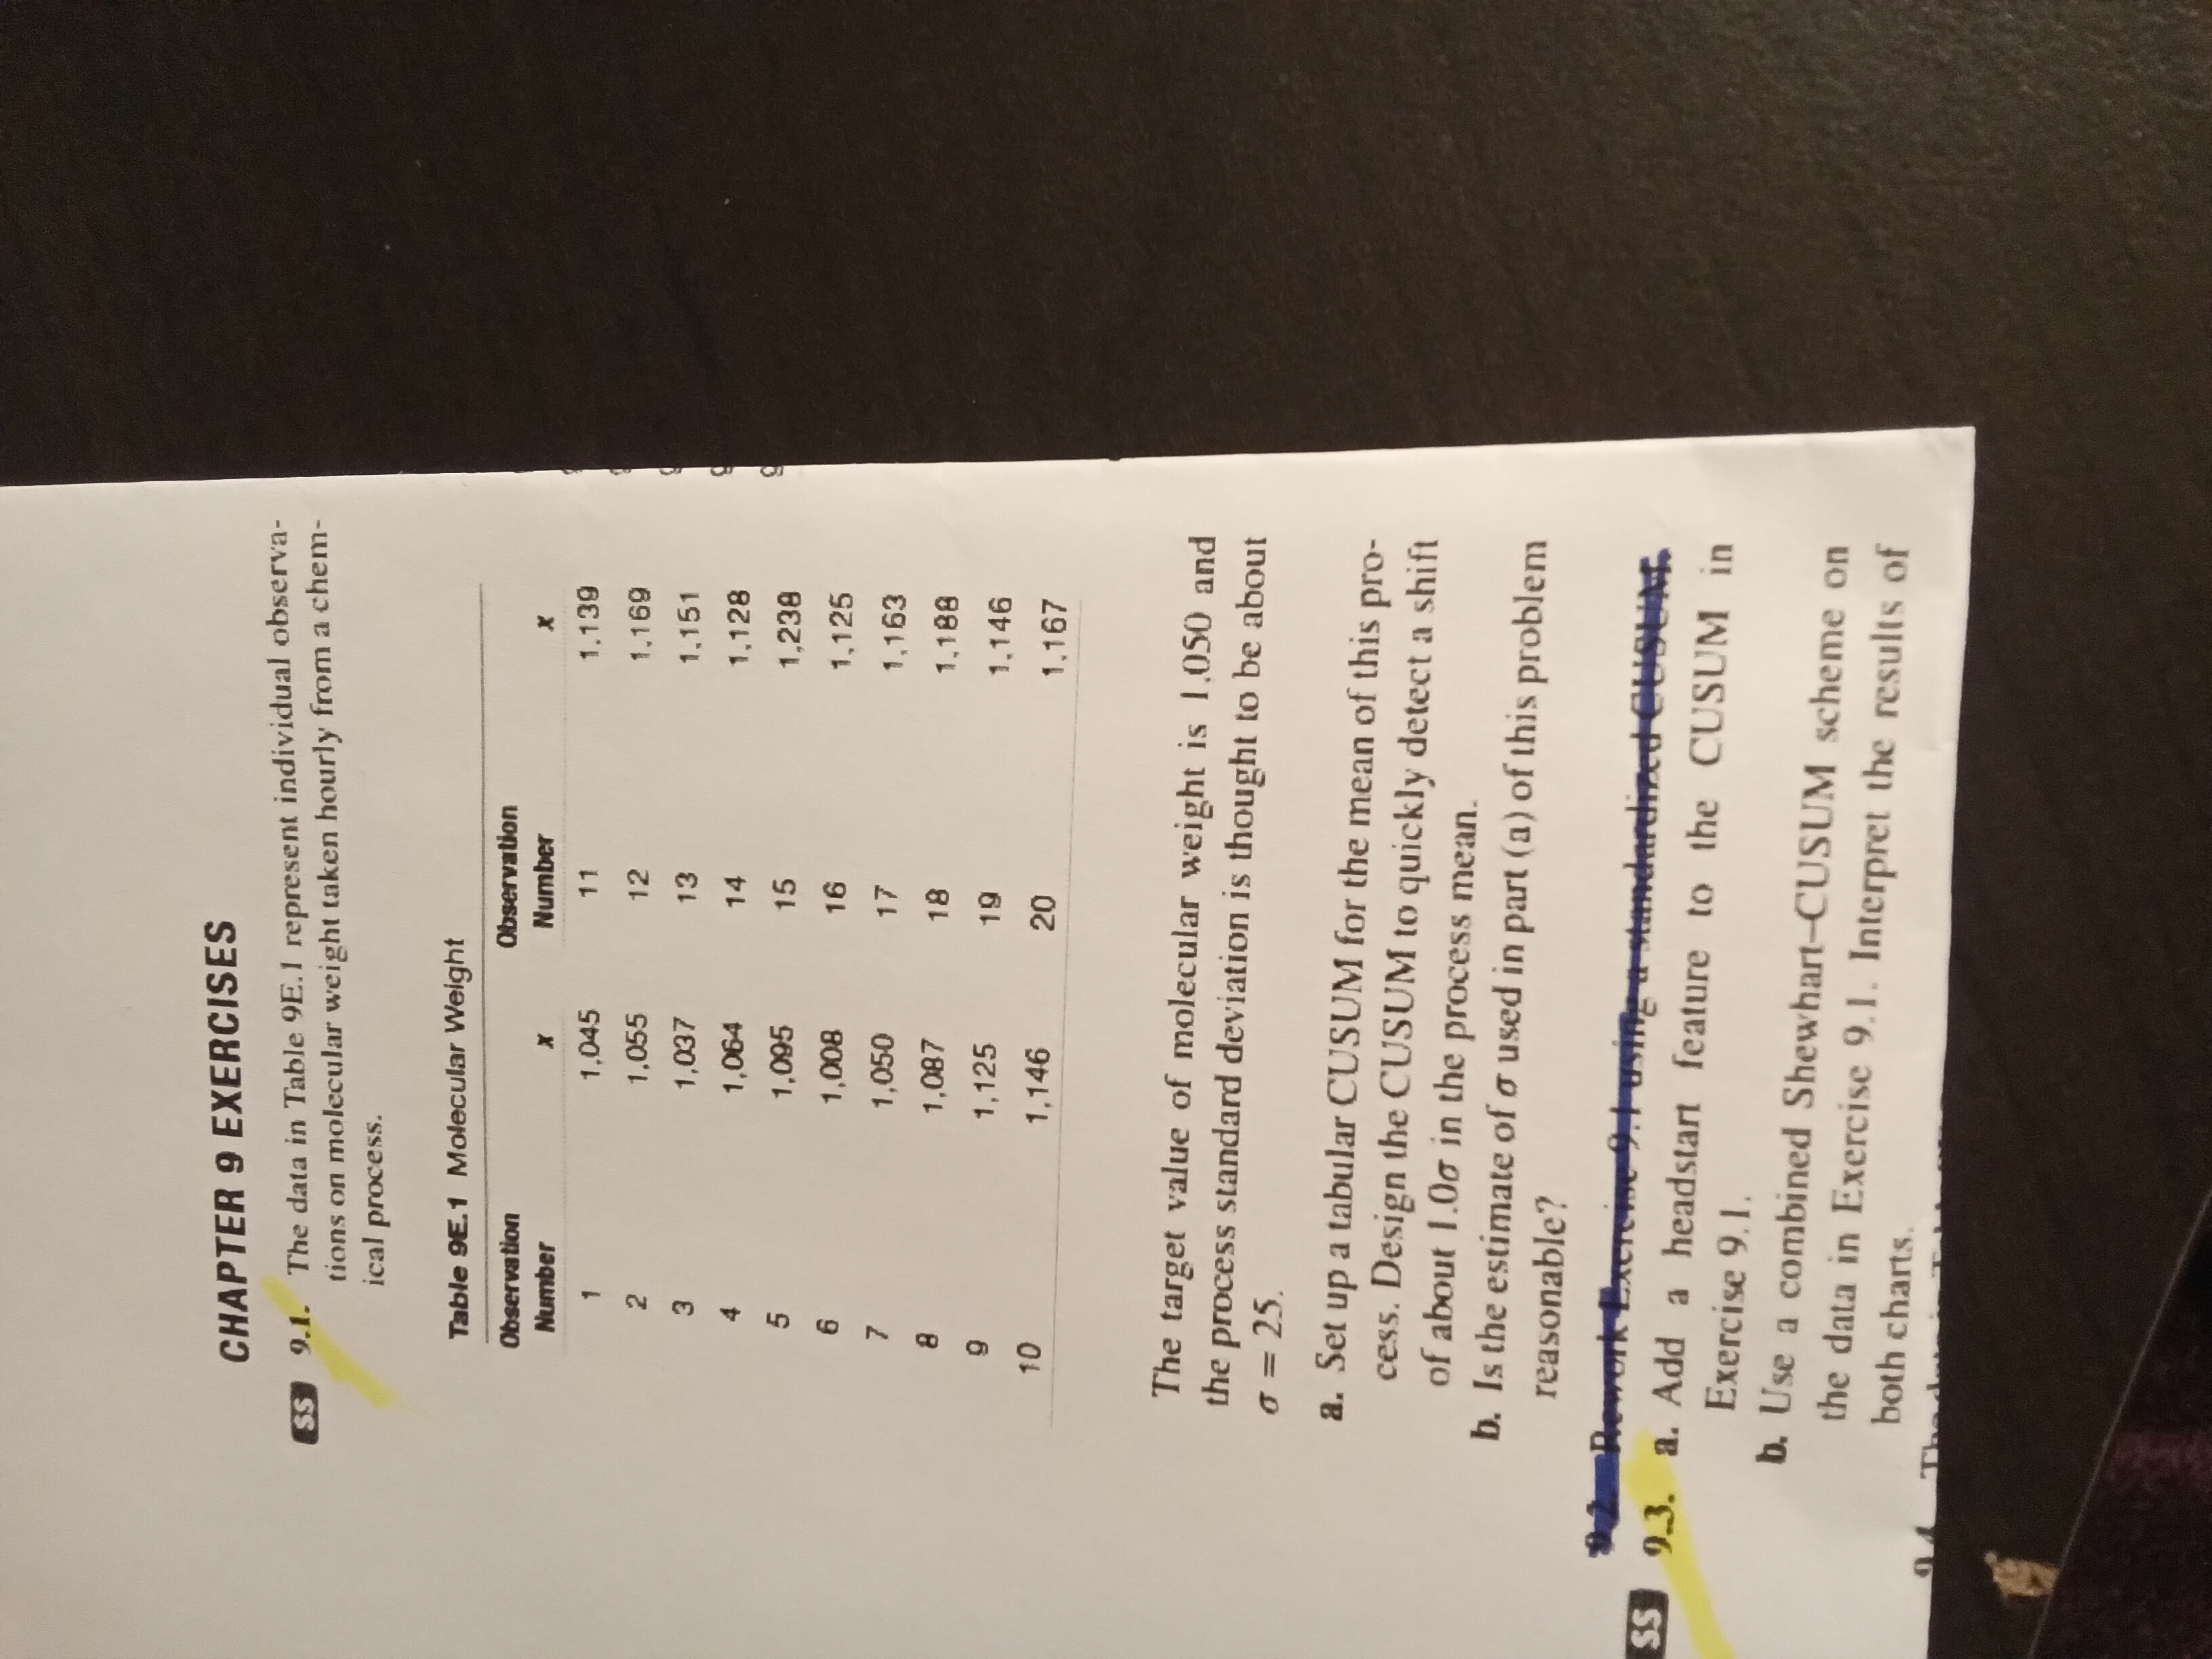
CHAPTER 9 EXERCISES S$ 9.1. The data in Table 9E.1 represent individual observa- tions on molecular weight taken hourly from a chem- ical process. Table 9E.1 Molecular Weight Observation Observation Number Number 1 1.045 1 1 1.139 2 1.055 12 1.169 3 1,037 13 1,151 1,064 14 1,128 1,095 15 1,238 1,008 16 1,125 1,050 17 1,163 1,087 18 1.188 1, 125 19 1.146 1,146 20 1,167 The target value of molecular weight is 1.050 and the process standard deviation is thought to be about 0 = 25. a. Set up a tabular CUSUM for the mean of this pro- cess. Design the CUSUM to quickly detect a shift of about 1.0g in the process mean. b. Is the estimate of o used in part (a) of this problem reasonable? SS work Extreme .I using a standardized Count 9.3. a. Add a headstart feature to the CUSUM in Exercise 9.1. b. Use a combined Shewhart-CUSUM scheme on the data in Exercise 9.1. Interpret the results of both charts
Step by Step Solution
There are 3 Steps involved in it

Get step-by-step solutions from verified subject matter experts