

Question: 9 : 3 9 AM Tue Mar 2 6 9 9 % Application Question A department store manager explored the relationship between the percent of
: AM Tue Mar
Application
Question
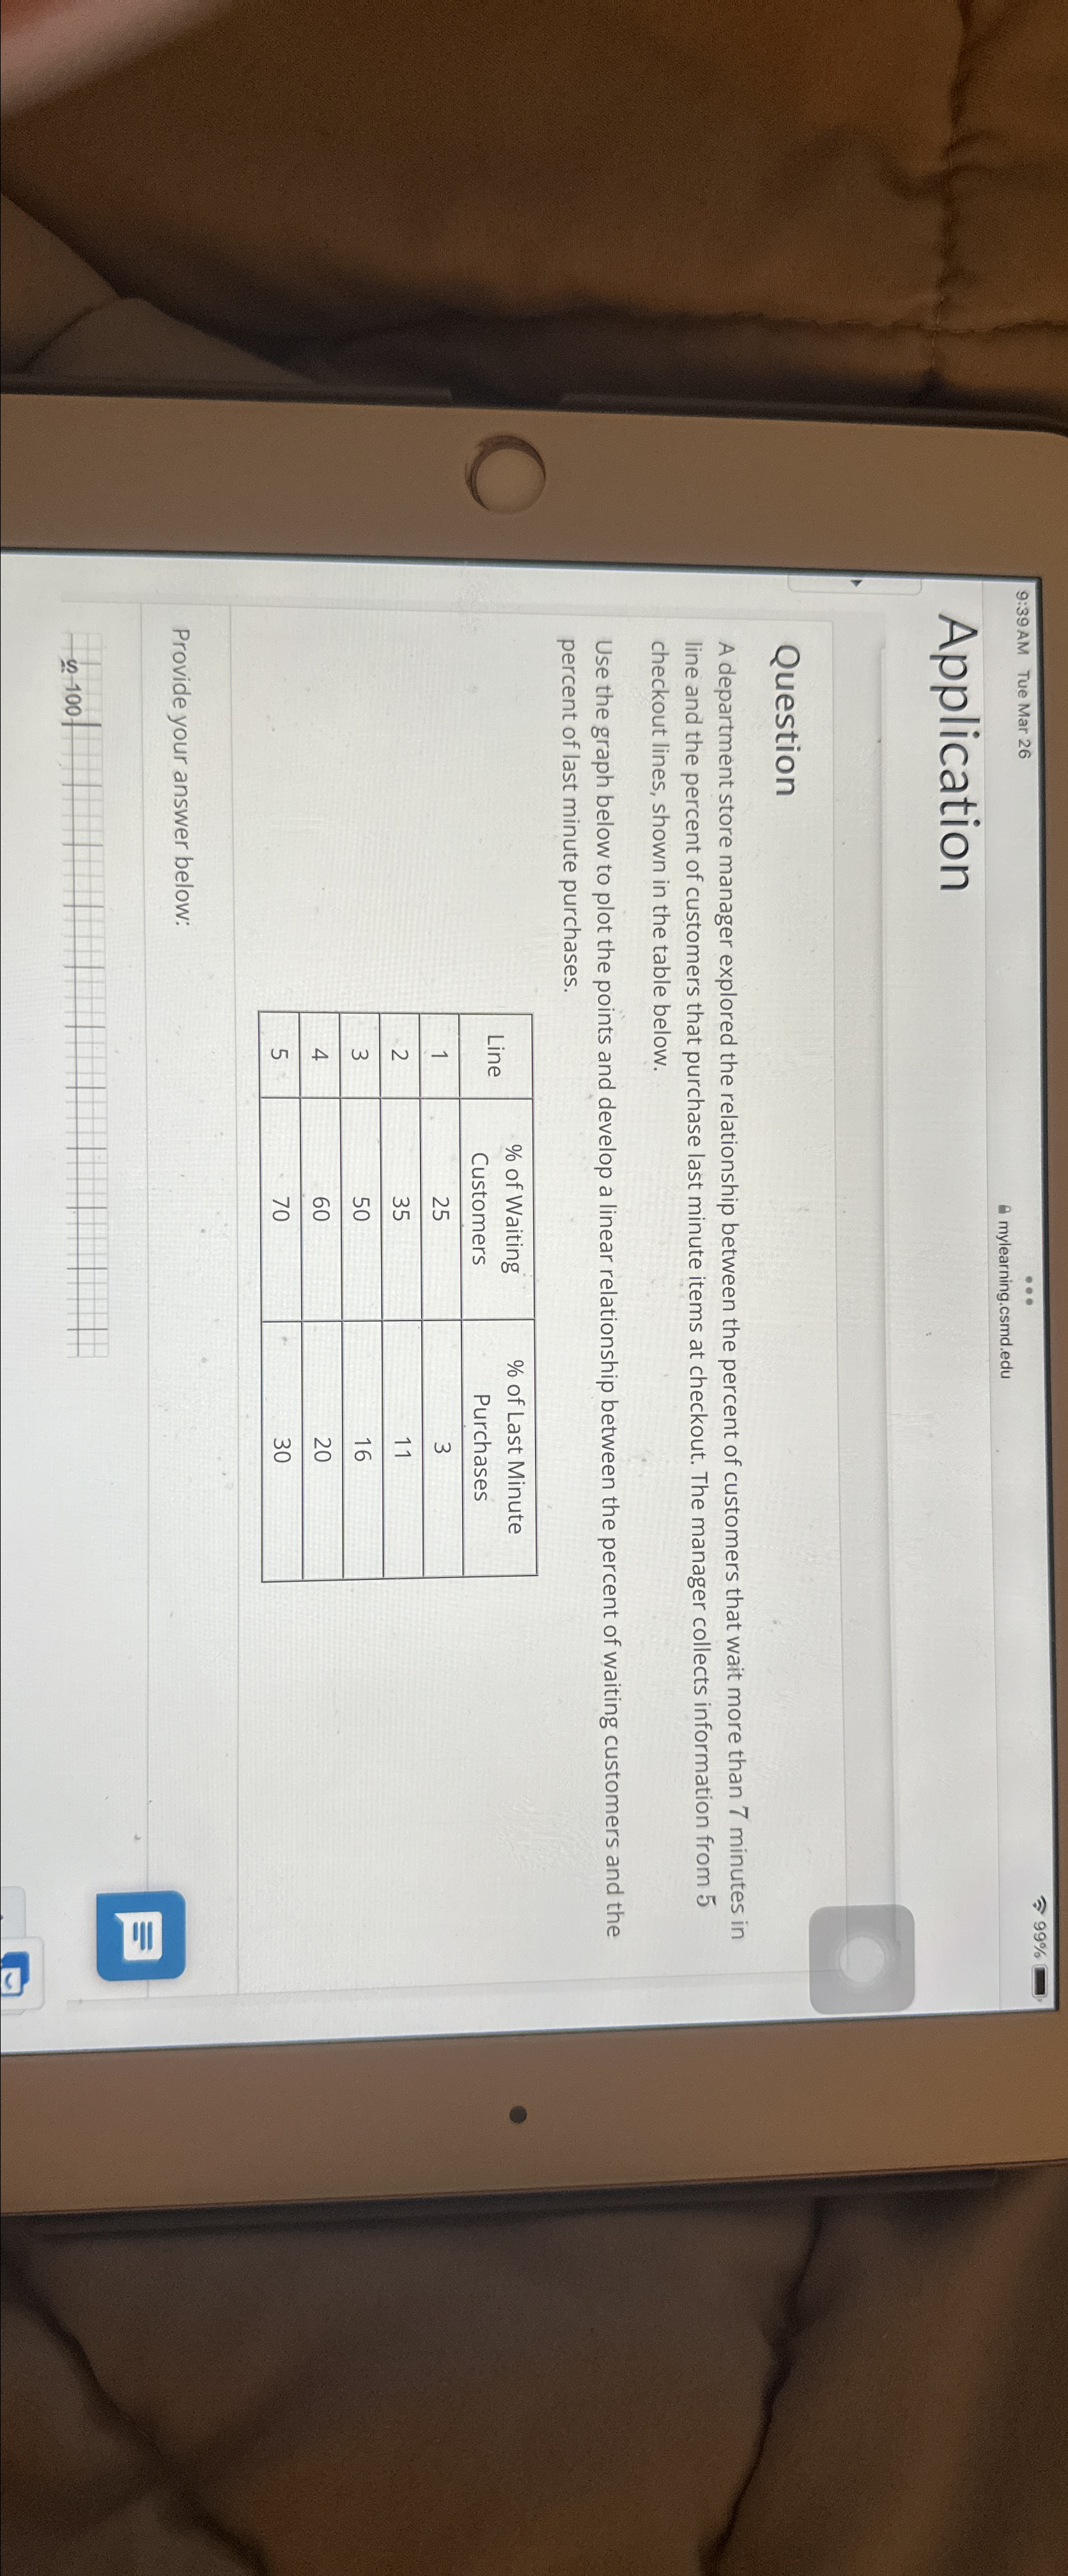
A department store manager explored the relationship between the percent of customers that wait more than minutes in line and the percent of customers that purchase last minute items at checkout. The manager collects information from checkout lines, shown in the table below.
Use the graph below to plot the points and develop a linear relationship between the percent of waiting customers and the percent of last minute purchases.
tableLinetable of WaitingCustomerstable of Last MinutePurchases
Provide your answer below:
n
Step by Step Solution
There are 3 Steps involved in it
1 Expert Approved Answer
Step: 1 Unlock

Question Has Been Solved by an Expert!
Get step-by-step solutions from verified subject matter experts
Step: 2 Unlock
Step: 3 Unlock