

Question: 9. Chebyshev's rule states that 68% of the observations on a variable will lie within plus or minus two standard deviations from the mean value


9. Chebyshev's rule states that 68% of the observations on a variable will
lie within plus or minus two standard deviations from the mean value for
that variable. True or False. Explain your answer fully.
10. A manufacturer of automobile batteries claims that the average length
of life for its grade A battery is 60 months. But the guarantee on this brand
is for just 36 months. Suppose that the frequency distribution of the lifelength data is unimodal and symmetrical and that the standard deviation is
known to be 10 months. Suppose further that your battery lasts 37 months.
What could you infer, if anything, about the manufacturer's claim?
11. At one university, the students are given z-scores at the end of each
semester rather than the traditional GPA's. The mean and standard deviations of all students' cumulative GPA's on which the z-scores are based
are 2.7 and 0.5 respectively. Students with z-scores below -1.6 are put on
probation. What is the corresponding probationary level of the GPA?
12. Two variables have identical standard deviations and a covariance equal
to half that common standard deviation. If the standard deviation of the
two variables is 2, what is the correlation coefficient between them?
13. Application of Chebyshev's rule to a data set that is roughly symmetrically distributed implies that at least one-half of all the observations lie in
the interval from 3.6 to 8.8. What are the approximate values of the mean
and standard deviation of this data set?
14. The number of defective items in 15 recent production lots of 100 items
each were as follows:
3, 1, 0, 2, 24, 4, 1, 0, 5, 8, 6, 3, 10, 4, 2
a) Calculate the mean number of defectives per lot. (4.87)
b) Array the observations in ascending order. Obtain the median of this
data set. Why does the median differ substantially from the mean
here? Obtain the range and the interquartile range. (3, 24, 4)
c) Calculate the variance and the standard deviation of the data set.
Which observation makes the largest contribution to the magnitude of
the variance through the sum of squared deviations? Which observation makes the smallest contribution? What general conclusions are
implied by these findings?
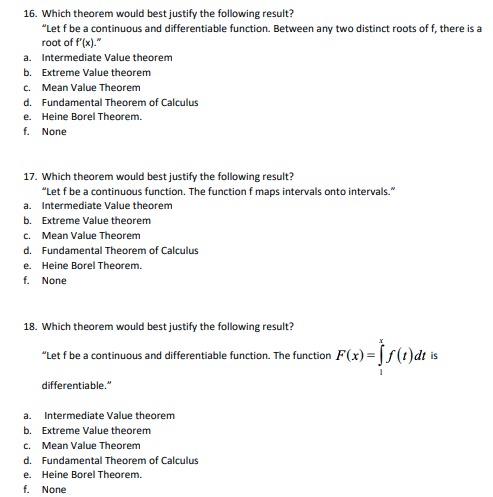
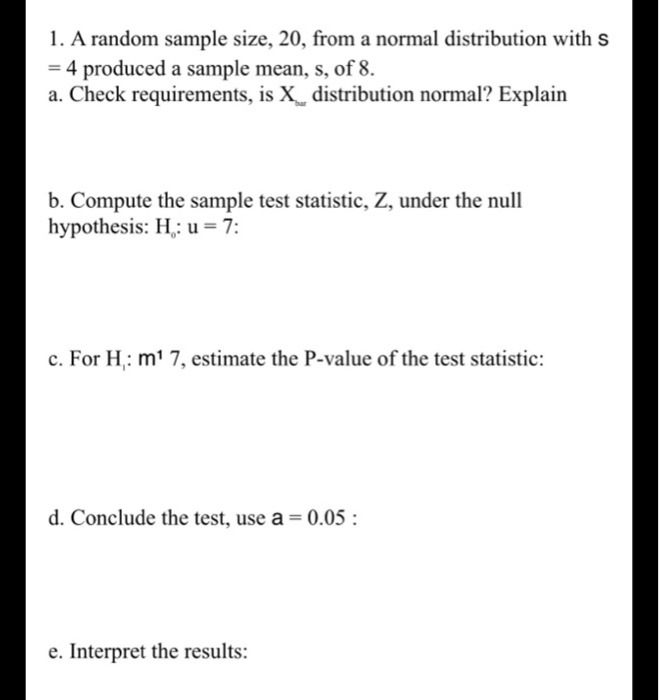
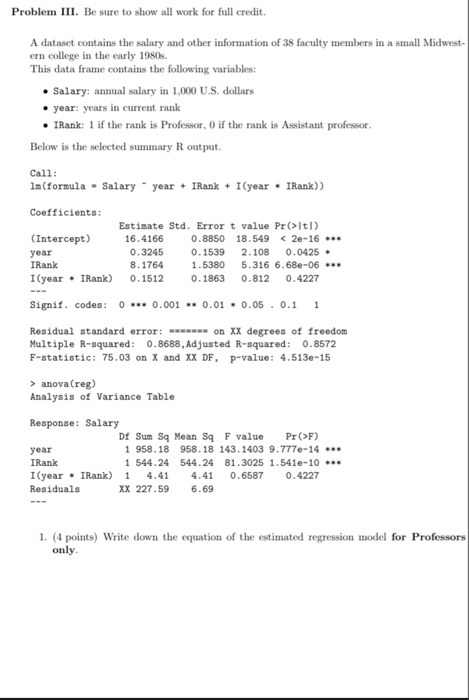


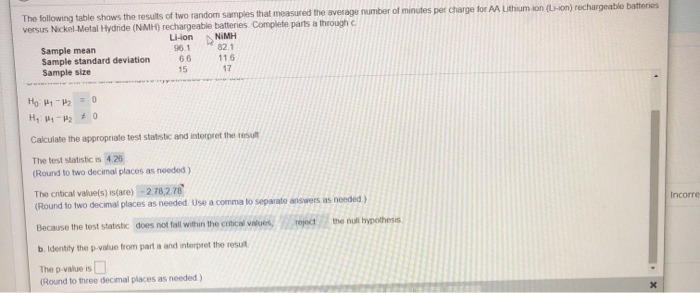
16. Which theorem would best justify the following result? "Let f be a continuous and differentiable function. Between any two distinct roots of f, there is a root of f(x)." a. Intermediate Value theorem b. Extreme Value theorem c. Mean Value Theorem d. Fundamental Theorem of Calculus e. Heine Borel Theorem. None 17. Which theorem would best justify the following result? "Let f be a continuous function. The function f maps intervals onto intervals." a. Intermediate Value theorem b. Extreme Value theorem C. Mean Value Theorem d. Fundamental Theorem of Calculus e. Heine Borel Theorem. None 18. Which theorem would best justify the following result? "Let f be a continuous and differentiable function. The function F(x) = [f (r)dr is differentiable." a. Intermediate Value theorem b. Extreme Value theorem c. Mean Value Theorem d. Fundamental Theorem of Calculus e. Heine Borel Theorem. f. Nonel. A random sample size, 20, from a normal distribution with s = 4 produced a sample mean, 5. of 8. a. Cheek requirements, is X,_ distribution normal? Explain b. Compute the sample test statistic, Z, under the null hypothesis: Ho: 11 = 7: e. For HI: \"1' I, estimate the P-value of the test statistic: d. Conelude the test, use a = 0.05 : e. Interpret the results: Problem III. Be sure to show all work for full credit. A dataset contains the salary and other information of 38 faculty members in a small Midwest- ern college in the early 1980s. This data frame contains the following variables: . Salary: annual salary in 1,000 U.S. dollars . year: years in current rank . IRank: 1 if the rank is Professor, 0 if the rank is Assistant professor. Below is the selected summary R output. Call: Im(formula = Salary - year + IRank + I (year . IRank)) Coefficients: Estimate Std. Error t value Pr(Itl) (Intercept) 16.4166 0. 8850 18.549 anova (reg) Analysis of Variance Table Response: Salary Df Sum Sq Mean Sq F value Pr (>F) year 1 958. 18 958.18 143. 1403 9.7770-14 .. IRank 1 544.24 544.24 81.3025 1.541e-10 . I (year . IRank) 1 4.41 4.41 0. 6587 0.4227 Residuals XX 227 .59 6.69 1. (4 points) Write down the equation of the estimated regression model for Professors only.The following table shows the results of two random samples that measured the average number of minutes per charge for AA Lithium ion (Lion) rechargeable batteries versus Nickel Metal Hydride (NIMH) rechargeable batteries Complete parts a through c Li-don NIMH Sample mean 90.1 82.1 Sample standard deviation 116 Sample size 15 17 Ho P1 - 142 0 Calculate the appropriate test statistic and interpret the result The lost statistic is 4.20 (Round to two decimal places as needed ) The critical value(s] is(are) - 2.78,278 (Round to two decimal places as needed. Use a comma to separate answers as needed.) Income Because the test statistic does not fall within the cribcal values, Project the null hypothesis b. Identity the p-value from part a and interpret the result The p-value is (Round to three decimal places as needed.)Search 2:34 AM Wed May 20
Step by Step Solution
There are 3 Steps involved in it

Get step-by-step solutions from verified subject matter experts