

Question: (9) Fill in the missing values in the ANOVA tables below and answer the questions relating to each table and the provided plots. Df Sum
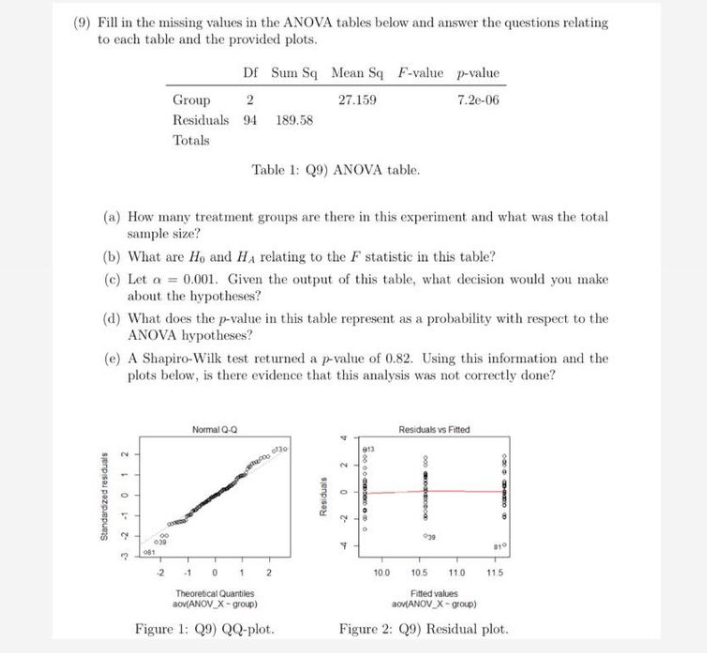

(9) Fill in the missing values in the ANOVA tables below and answer the questions relating to each table and the provided plots. Df Sum Sq Mean Sq F-value p-value Group 2 27.159 7.2c-06 Residuals 94 189.58 Totals Table 1: Q9) ANOVA table. (a) How many treatment groups are there in this experiment and what was the total sample size? (b) What are Ho and HA relating to the F statistic in this table? (c) Let a = 0.001. Given the output of this table, what decision would you make about the hypotheses? (d) What does the p-value in this table represent as a probability with respect to the ANOVA hypotheses? (e) A Shapiro-Wilk test returned a p-value of 0.82. Using this information and the plots below, is there evidence that this analysis was not correctly done? Normal 0-Q Residuals vs Fitted Standardized residuals Residuals 3-10 -3 10 0 10 5 110 115 Theoretical Quantiles Fitted values SOMANOV_X - group) BOVANOV_X - group) Figure 1: Q9) QQ-plot. Figure 2: Q9) Residual plot
Step by Step Solution
There are 3 Steps involved in it

Get step-by-step solutions from verified subject matter experts