

Question: 9. The box plot below shows the amount spent for books and supplies per year by students at four-year public colleges- $1,750 1,400 1,050
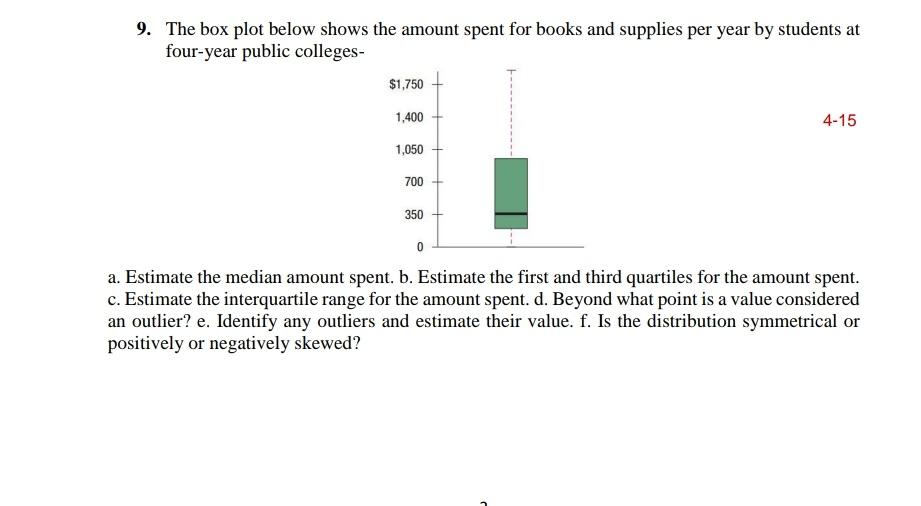
9. The box plot below shows the amount spent for books and supplies per year by students at four-year public colleges- $1,750 1,400 1,050 700 4-15 350 0 a. Estimate the median amount spent. b. Estimate the first and third quartiles for the amount spent. c. Estimate the interquartile range for the amount spent. d. Beyond what point is a value considered an outlier? e. Identify any outliers and estimate their value. f. Is the distribution symmetrical or positively or negatively skewed?
Step by Step Solution
3.47 Rating (147 Votes )
There are 3 Steps involved in it
a Estimate the median amount spent b Estimate the first and third quartiles for the amount spent c Estimate the interquartile range for the amount spe... View full answer

Get step-by-step solutions from verified subject matter experts