

Question: The box plot below shows the amount spent for books and supplies per year by students at four year public colleges. a. Estimate the median
The box plot below shows the amount spent for books and supplies per year by students at four year public colleges.
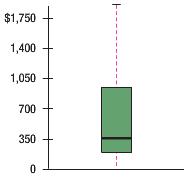
a. Estimate the median amount spent.
b. Estimate the first and third quartiles for the amount spent.
c. Estimate the interquartile range for the amount spent.
d. Beyond what point is a value considered an outlier?
e. Identify any outliers and estimate their value.
f. Is the distribution symmetrical or positively or negatively skewed?
$1,750 1,400 1,050 700 350
Step by Step Solution
3.45 Rating (164 Votes )
There are 3 Steps involved in it
a 350 The median amount spent is the value that divides the data into two equal halves with half the ... View full answer

Get step-by-step solutions from verified subject matter experts
Document Format (1 attachment)
356_6405e7a61f18d_230344.docx
120 KBs Word File