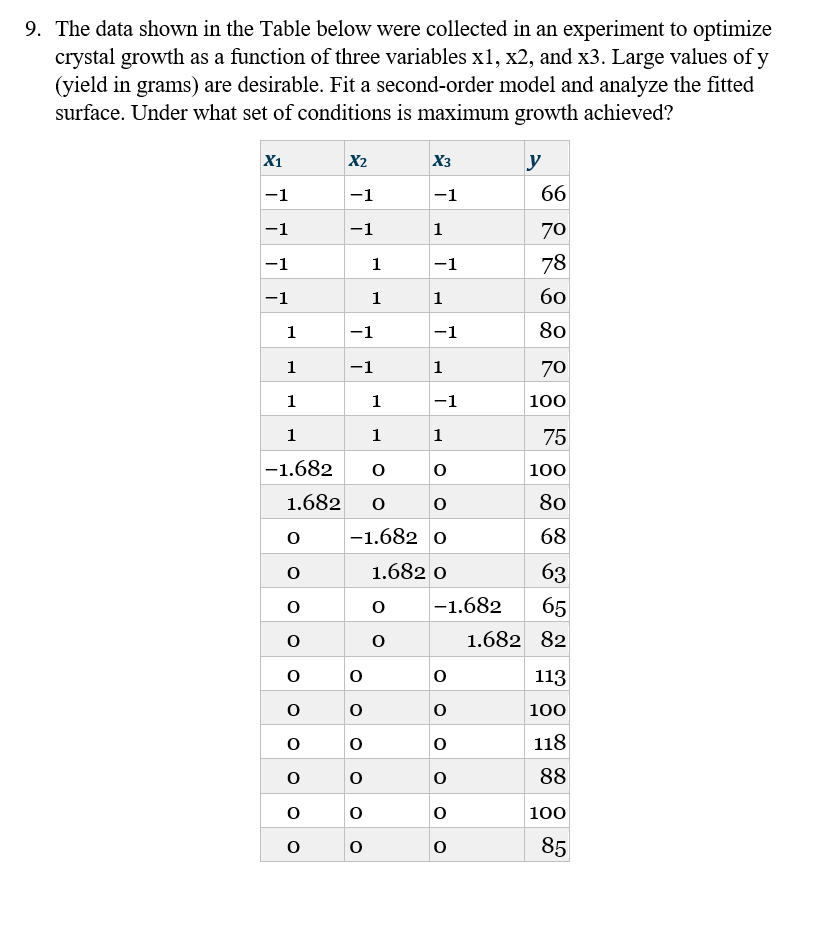
Question: 9. The data shown in the Table below were collected in an experiment to optimize crystal growth as a function of three variables x1, x2,

9. The data shown in the Table below were

9. The data shown in the Table below were collected in an experiment to optimize crystal growth as a function of three variables x1, x2, and x3. Large values of y (yield in grams) are desirable. Fit a second-order model and analyze the fitted surface. Under what set of conditions is maximum growth achieved? X1 X2 X3 66 -1 -1 -1 -1 -1 1 -1 1 -1 70 78 60 -1 1 1 1 -1 -1 80 1 -1 1 70 1 1 -1 100 1 1 1 75 -1.682 O o 100 1.682 o 0 80 o -1.682 0 68 o 1.682 0 O O -1.682 o O 1.682 82 63 65 o o 0 113 100 0 O o o O o 118 0 o o 88 o 0 0 100 o o o 85

Step by Step Solution

There are 3 Steps involved in it

1 Expert Approved Answer
Step: 1 Unlock blur-text-image
Question Has Been Solved by an Expert!

Get step-by-step solutions from verified subject matter experts

Step: 2 Unlock
Step: 3 Unlock

Students Have Also Explored These Related General Management Questions!