

Question: 11.8. The data shown in the Table P11.2 were collected in an experiment to optimize crystal growth as a function of three variables x1, x2,
11.8. The data shown in the Table P11.2 were collected in an experiment to optimize crystal growth as a function of three variables x1, x2, and x3. Large values of y (yield in grams)
are desirable. Fit a second-order model and analyze the fitted surface. Under what set of conditions is maximum growth achieved?
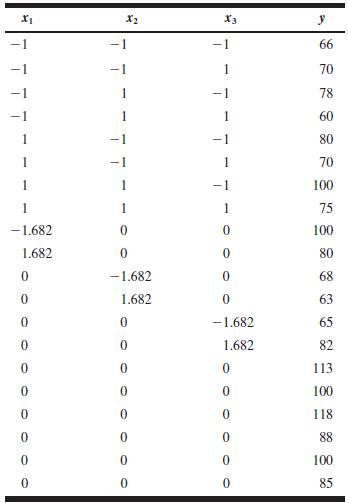
x x2 x3 y T T -1 66 70 78 60 80 70 100 1 75 -1.682 0 0 100 1.682 0 0 80 -1.682 0 68 0 1.682 0 63 0 0 -1.682 65 0 0 1.682 82 0 0 113 0 0 0 100 0 0 0 118 0 0 0 0 0 000 88 100 85 85
Step by Step Solution
There are 3 Steps involved in it
1 Expert Approved Answer
Step: 1 Unlock

Question Has Been Solved by an Expert!
Get step-by-step solutions from verified subject matter experts
Step: 2 Unlock
Step: 3 Unlock