

Question: 9. Using Figure 9-13 below: a. Draw isobars at 4-mb intervals (e.g., 1004 mb, 1008 mb, 1012 mb). b. Label the low pressure center
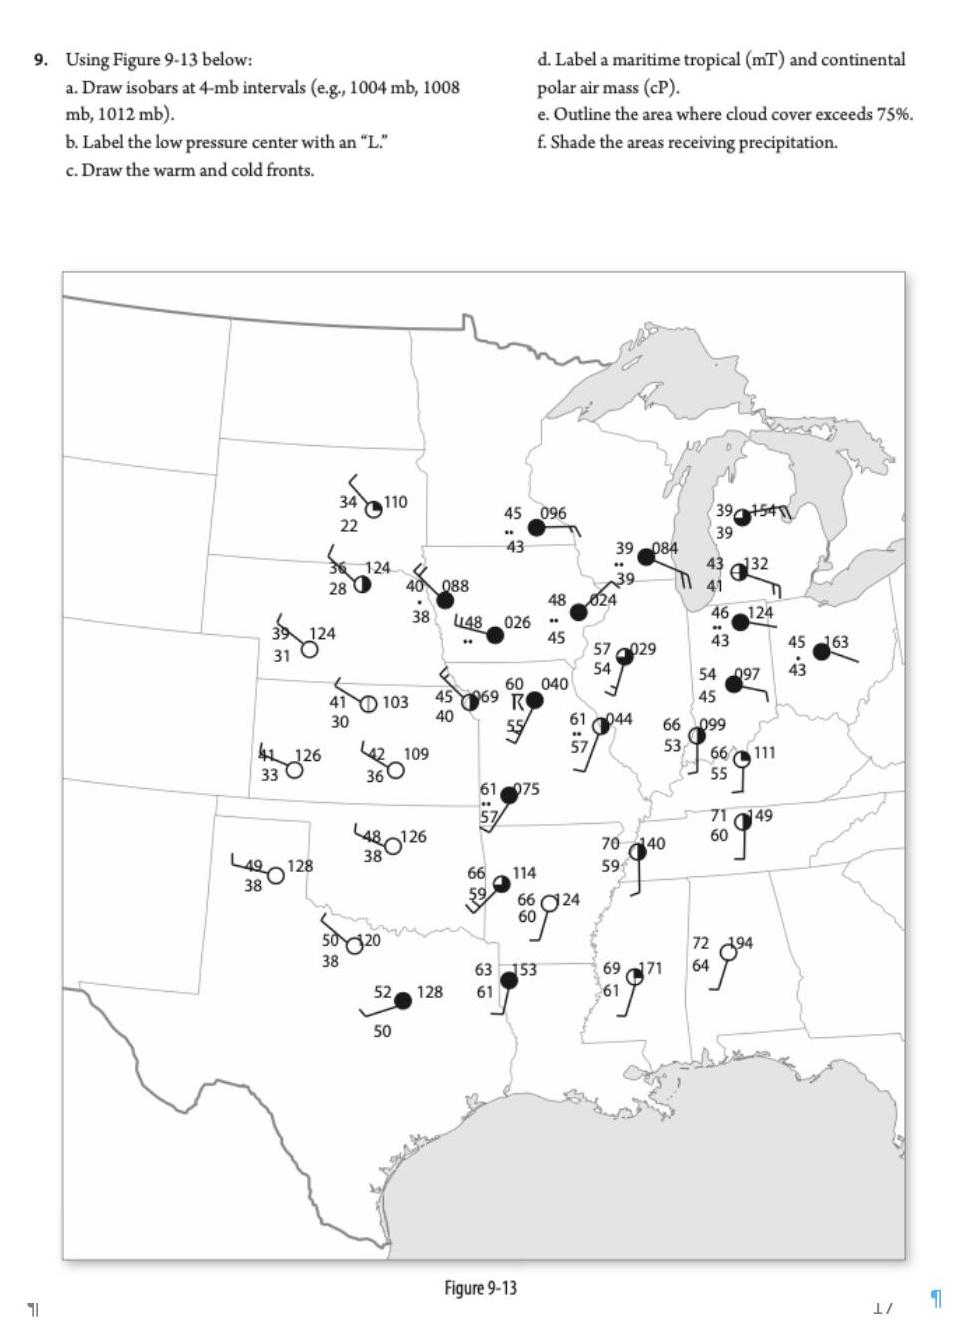
9. Using Figure 9-13 below: a. Draw isobars at 4-mb intervals (e.g., 1004 mb, 1008 mb, 1012 mb). b. Label the low pressure center with an "L." c. Draw the warm and cold fronts. d. Label a maritime tropical (mT) and continental polar air mass (CP). e. Outline the area where cloud cover exceeds 75%. f. Shade the areas receiving precipitation. 34 22 110 45 096 39154 39 43 39 084 36 124 28 132 39 40 088 48 024 38 46 124 448 026 39 124 45 43 45 163 57 029 31 54 41 103 45 60 040 69 R 54 097 45 4. 43 30 40 61 126 109 33 O 5:57 66 099 53 66111 36 55 L48 126 5:57 61 975 71 49 60 70 40 48128 38 66 59 114 38 59 66 24 20 72 194 38 63 153 69 64 52 128 61 61 50 Figure 9-13 F 71 1/ 1
Step by Step Solution
There are 3 Steps involved in it

Get step-by-step solutions from verified subject matter experts