

Question: 9:34 . LTE AA mylab.pearson.com C - X Frequency distribution Temperature ( F) Frequency 31-64 30 65-67 63 68-69 200 70 200 71-72 123 73-76
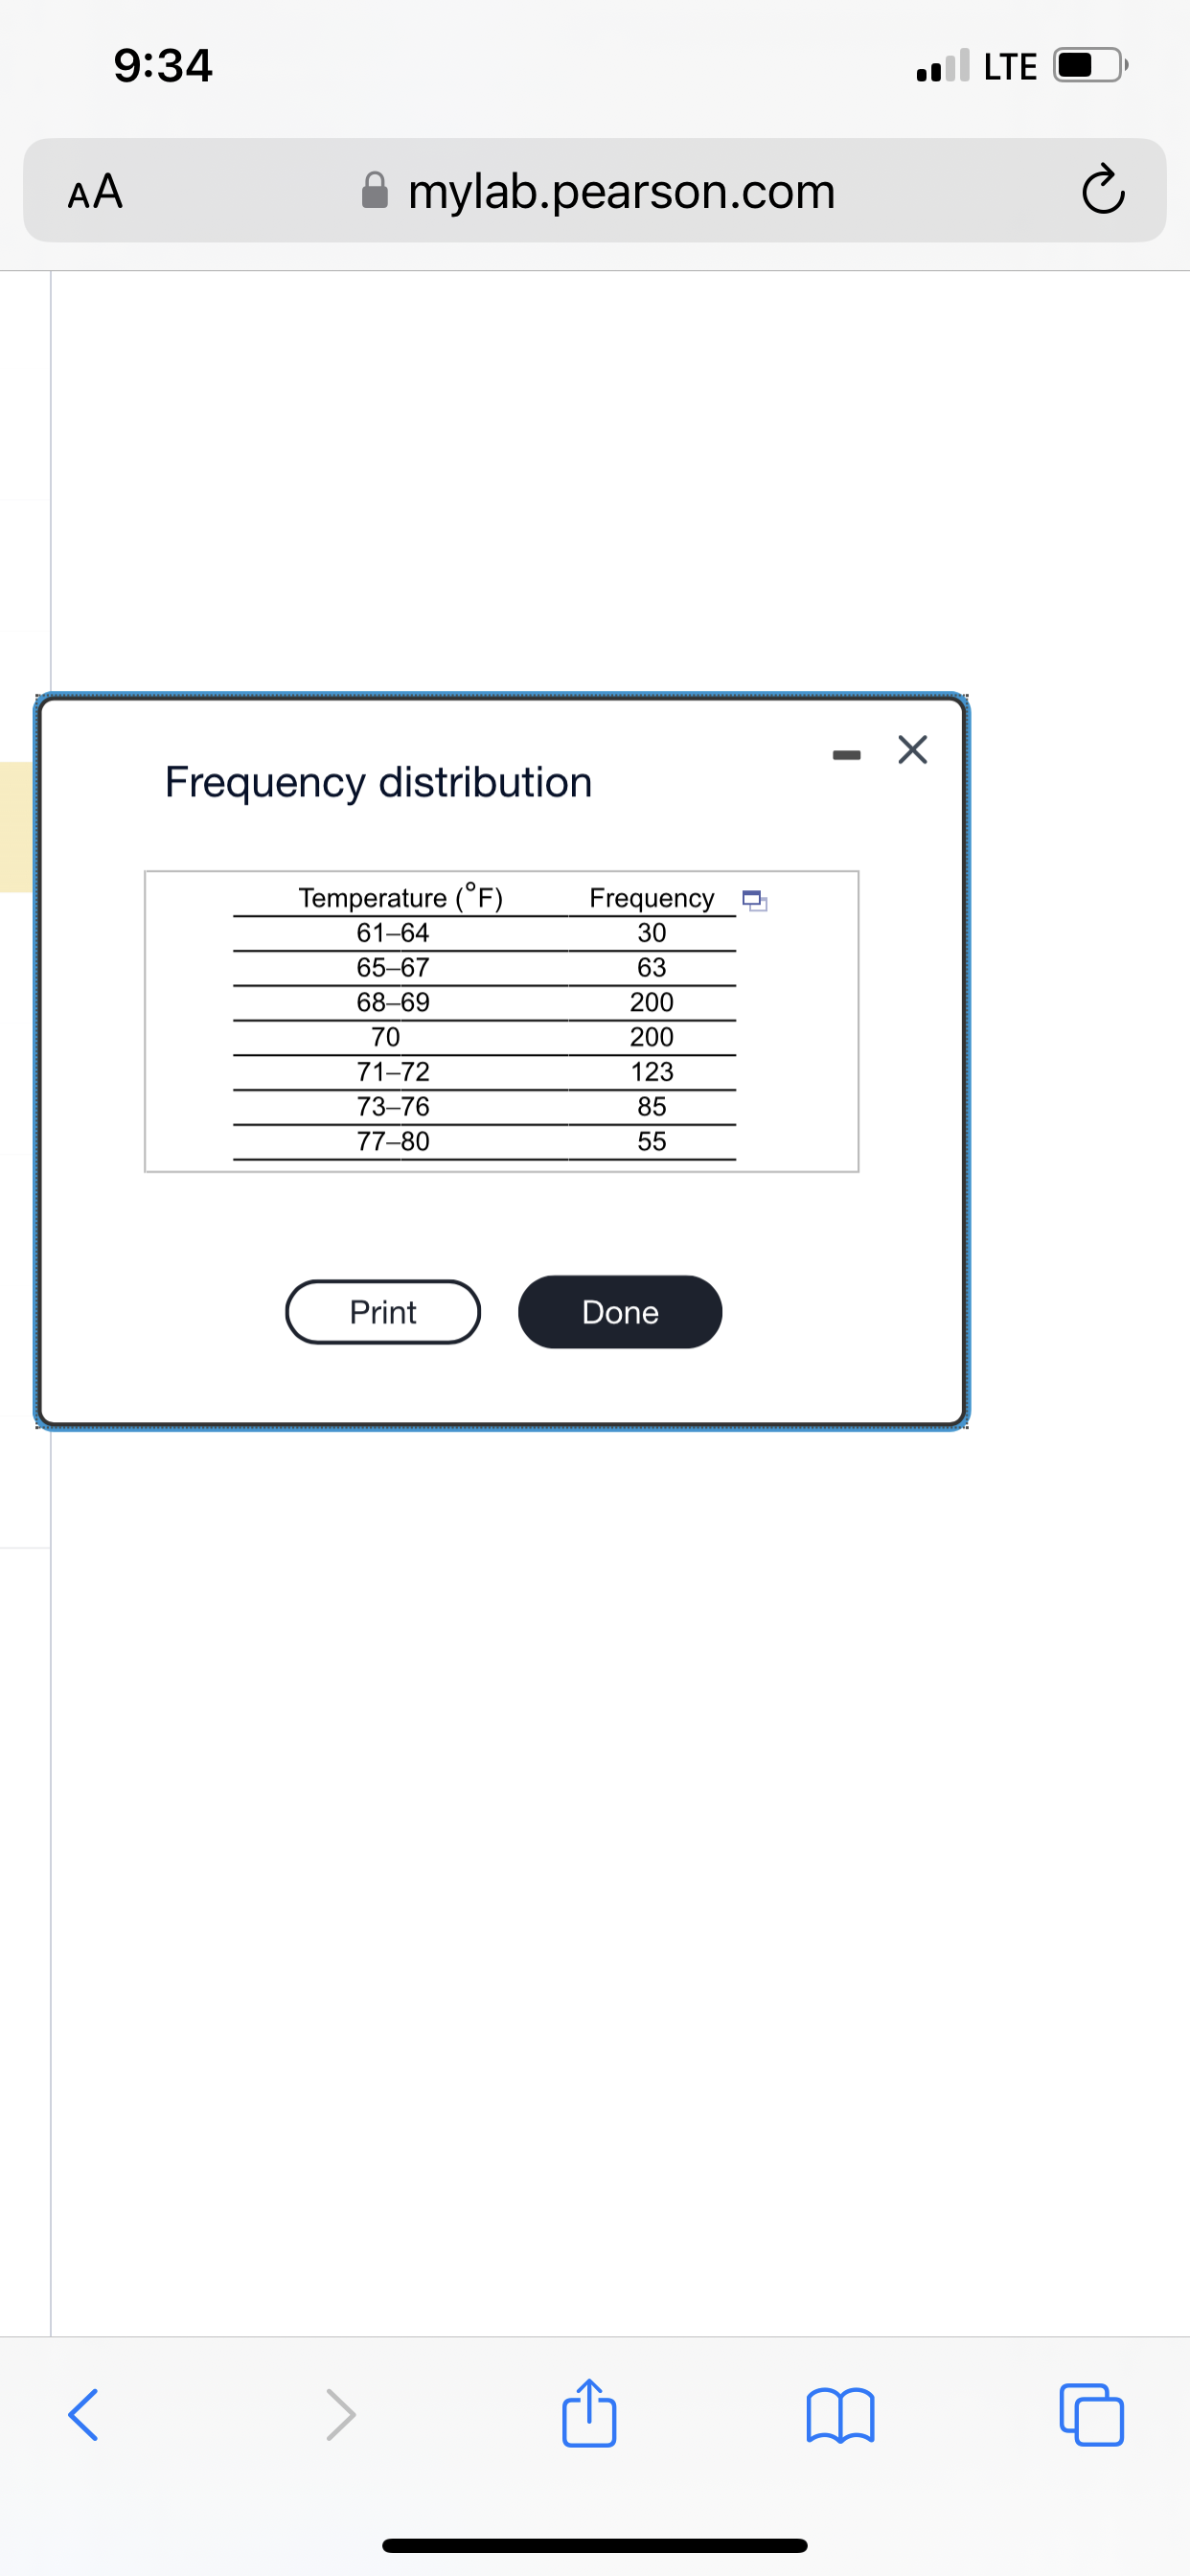
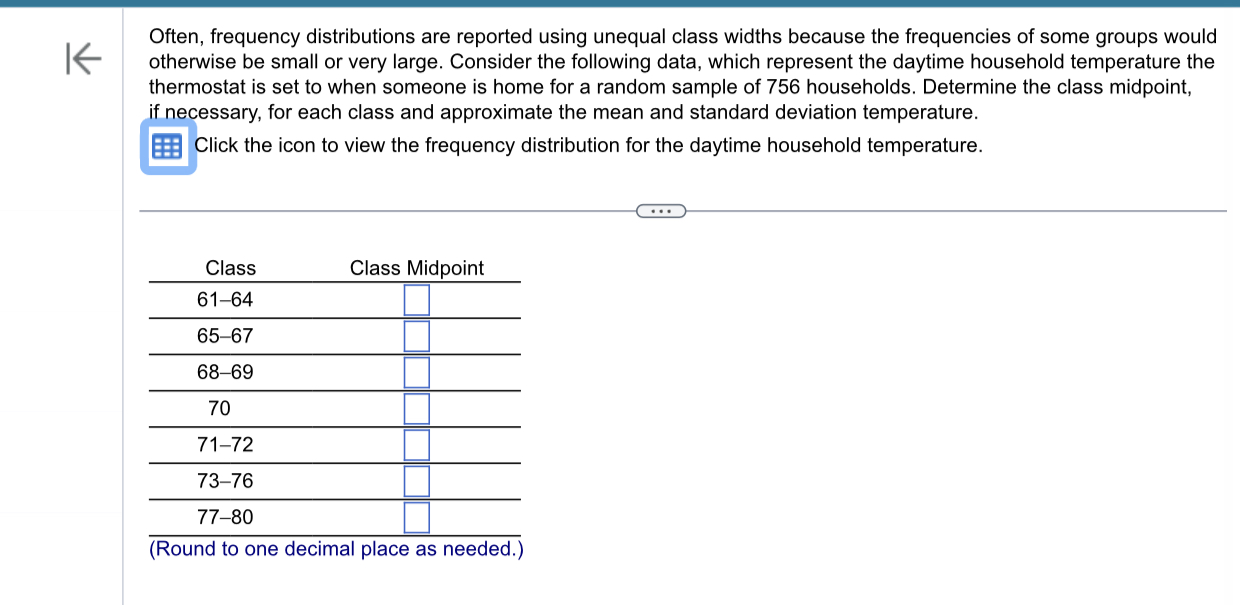
9:34 . LTE AA mylab.pearson.com C - X Frequency distribution Temperature ( F) Frequency 31-64 30 65-67 63 68-69 200 70 200 71-72 123 73-76 85 77-80 55 Print Donel Often, frequency distributions are reported using unequal class widths because the frequencies of some groups would otherwise be small or very large. Consider the following data. which represent the daytime household temperature the thermostat is set to when someone is home for a random sample of 756 households. Determine the class midpoint, if necessary. for each class and approximate the mean and standard deviation temperature. @ Click the icon to View the frequency distribution for the daytime household temperature. (:3 Class Class Midpoint 6164 6567 6869 70 71 72 7376 7780 (Round to one decimal place as needed.) LlLl|_l|_lLlLll_l
Step by Step Solution
There are 3 Steps involved in it

Get step-by-step solutions from verified subject matter experts