

Question: A 1-2 Q1:- By using PERT method draw the network diagram and determine expected time (Te), crtical path (cp), stander deviation(s), variance (v))and(z) of finishing
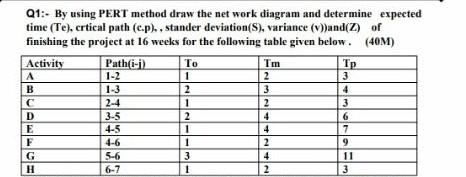
A 1-2 Q1:- By using PERT method draw the network diagram and determine expected time (Te), crtical path (cp), stander deviation(s), variance (v))and(z) of finishing the project at 16 weeks for the following table given below. (40M) Activity Path(i-i) To Tm 1 2 3 B 1-3 2 3 4 2-4 1 2 3 D 3-5 2 4 6 E 4-5 1 1 4 7 F 4-6 1 2 9 G 5-6 3 4 11 H1 6-7 1 2 3
Step by Step Solution
There are 3 Steps involved in it
1 Expert Approved Answer
Step: 1 Unlock

Question Has Been Solved by an Expert!
Get step-by-step solutions from verified subject matter experts
Step: 2 Unlock
Step: 3 Unlock