

Question: a = .3 t D Qtr Demand Ft Forecast E Error Year Period * 2015 1 -7 193 237 265 At Average 167 198 232
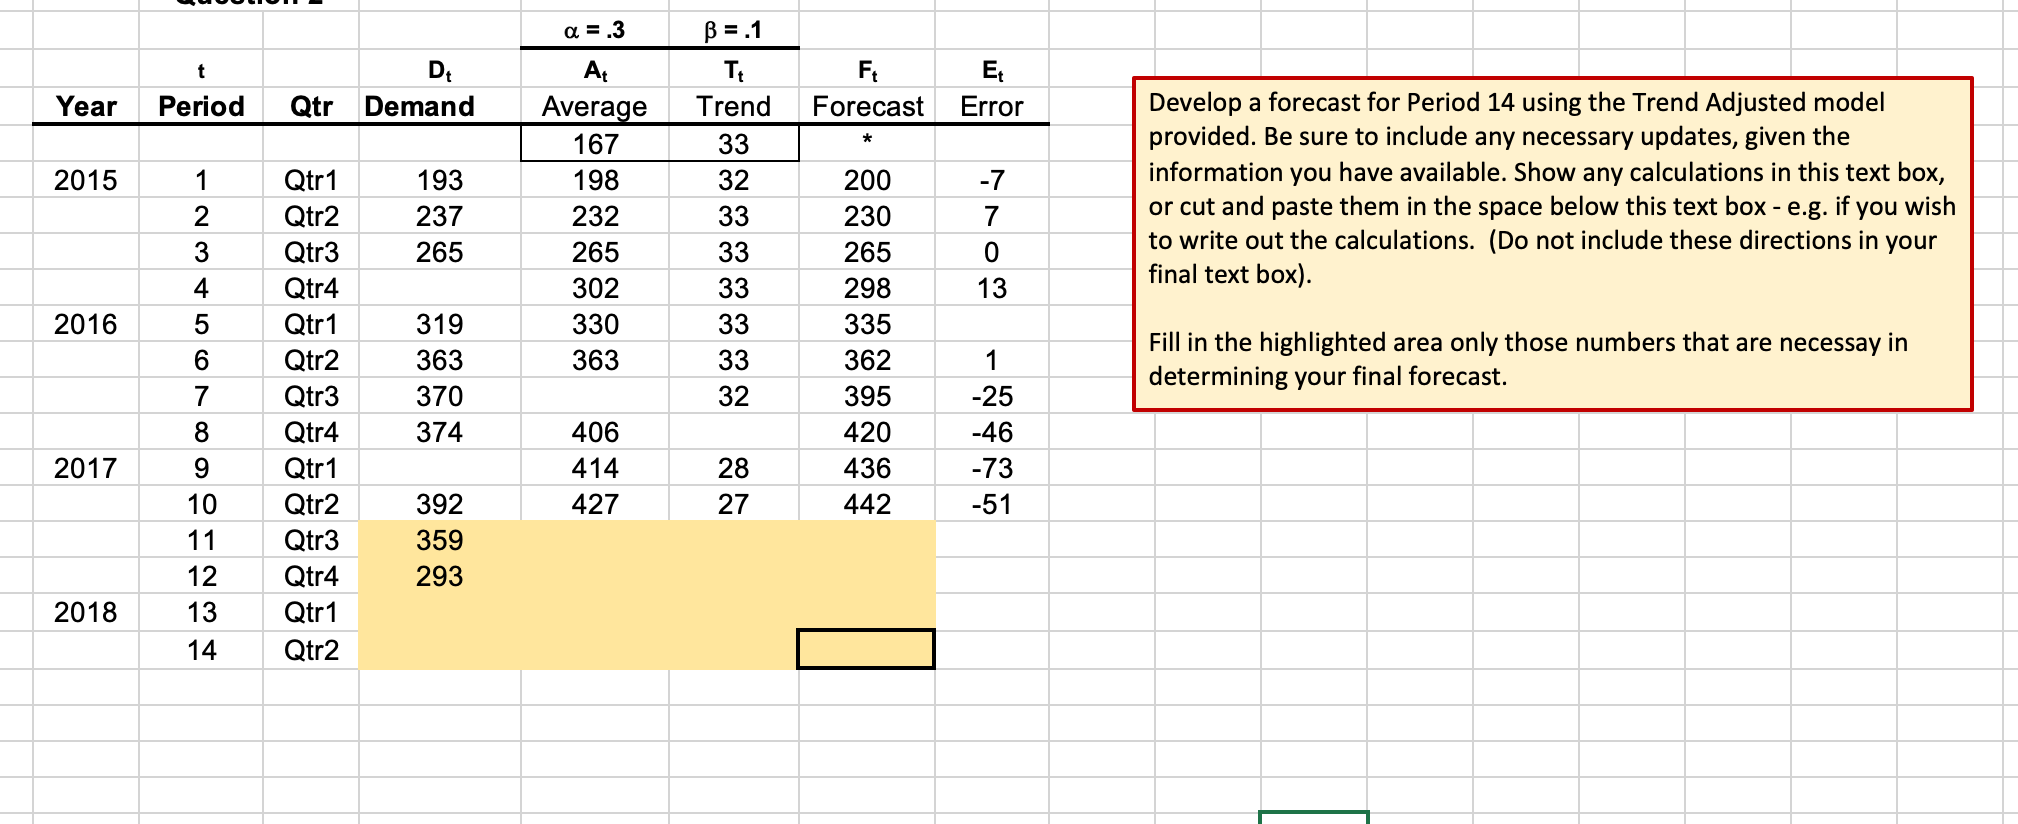
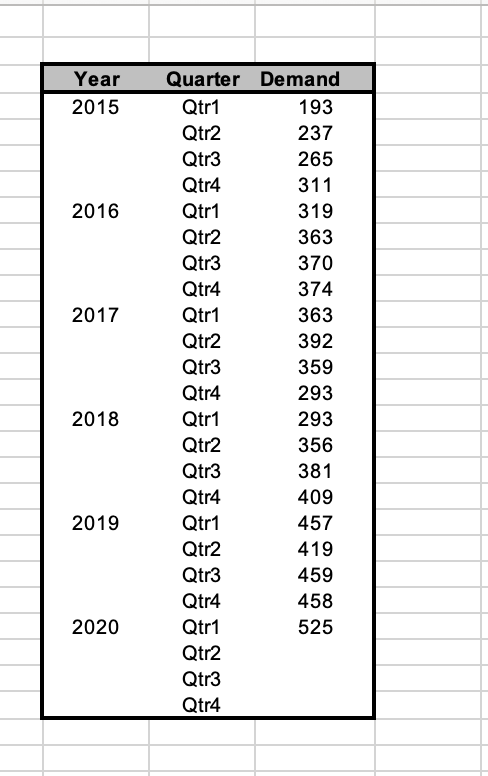
a = .3 t D Qtr Demand Ft Forecast E Error Year Period * 2015 1 -7 193 237 265 At Average 167 198 232 265 302 330 363 2 3 B = .1 TE Trend 33 32 33 33 33 33 33 32 Develop a forecast for Period 14 using the Trend Adjusted model provided. Be sure to include any necessary updates, given the information you have available. Show any calculations in this text box, or cut and paste them in the space below this text box - e.g. if you wish to write out the calculations. (Do not include these directions in your final text box). 7 0 13 2016 5 6 7 Qtr 1 Qtr2 Qtr3 Qtr4 Qtr 1 Qtr2 Qtr3 Qtr4 Qtr 1 Qtr2 Qtr3 Qtr4 Qtr 1 Qtr2 319 363 370 374 200 230 265 298 335 362 395 420 436 442 Fill in the highlighted area only those numbers that are necessay in determining your final forecast. -25 -46 -73 -51 406 414 427 2017 28 27 9 10 11 12 13 14 392 359 293 2018 Year 2015 2016 2017 Quarter Demand Qtr1 193 Qtr2 237 Qtr3 265 Qtr4 311 Qtr 1 319 Qtr2 363 Qtr3 370 Qtr4 374 Qtr1 363 Qtr2 392 Qtr3 359 Qtr4 293 Qtr 1 293 Qtr2 356 Qtr3 381 Qtr4 409 Qtr1 457 Qtr2 419 Qtr3 459 Qtr4 458 Qtr1 525 Qtr2 Qtr3 Qtr4 2018 2019 2020
Step by Step Solution
There are 3 Steps involved in it
1 Expert Approved Answer
Step: 1 Unlock

Question Has Been Solved by an Expert!
Get step-by-step solutions from verified subject matter experts
Step: 2 Unlock
Step: 3 Unlock