

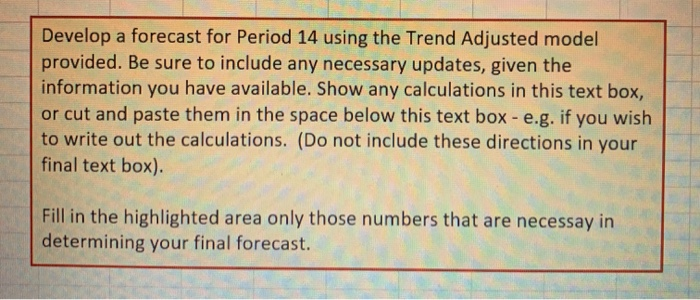
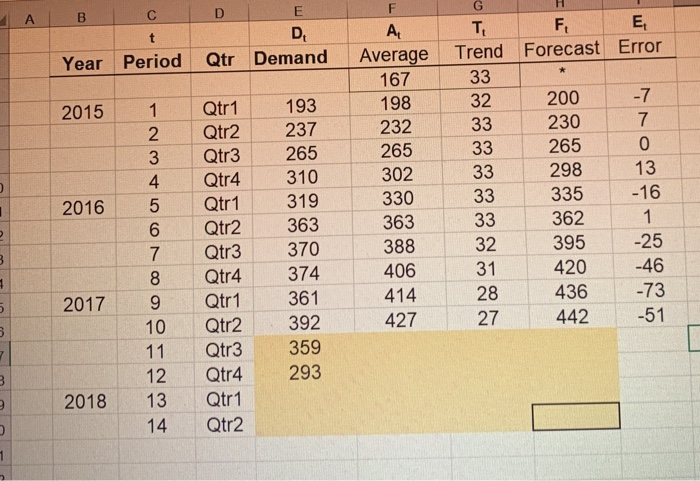
Question: (shaded region only needs to be solved) raw data Develop a forecast for Period 14 using the Trend Adjusted model provided. Be sure to include
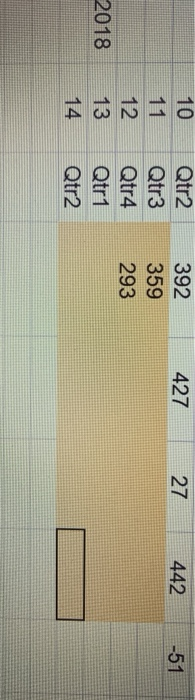
 (shaded region only needs to be solved)
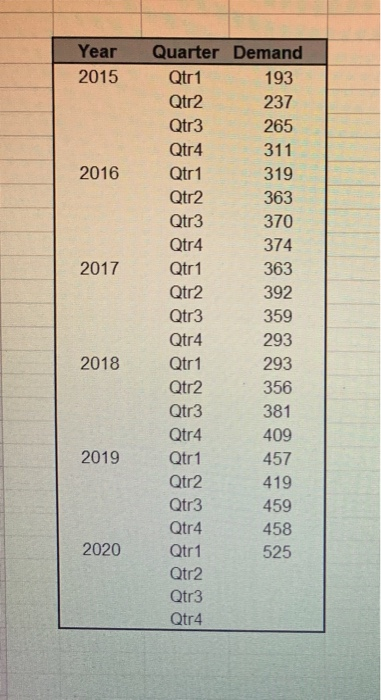
raw data

Step by Step Solution
There are 3 Steps involved in it
1 Expert Approved Answer
Step: 1 Unlock

Question Has Been Solved by an Expert!
Get step-by-step solutions from verified subject matter experts
Step: 2 Unlock
Step: 3 Unlock