

Question: (a) (8 points) Consider the network shown in Figure 1. The circles represent indepen- dent routers, and edges (lines) represent links between routers. Each line
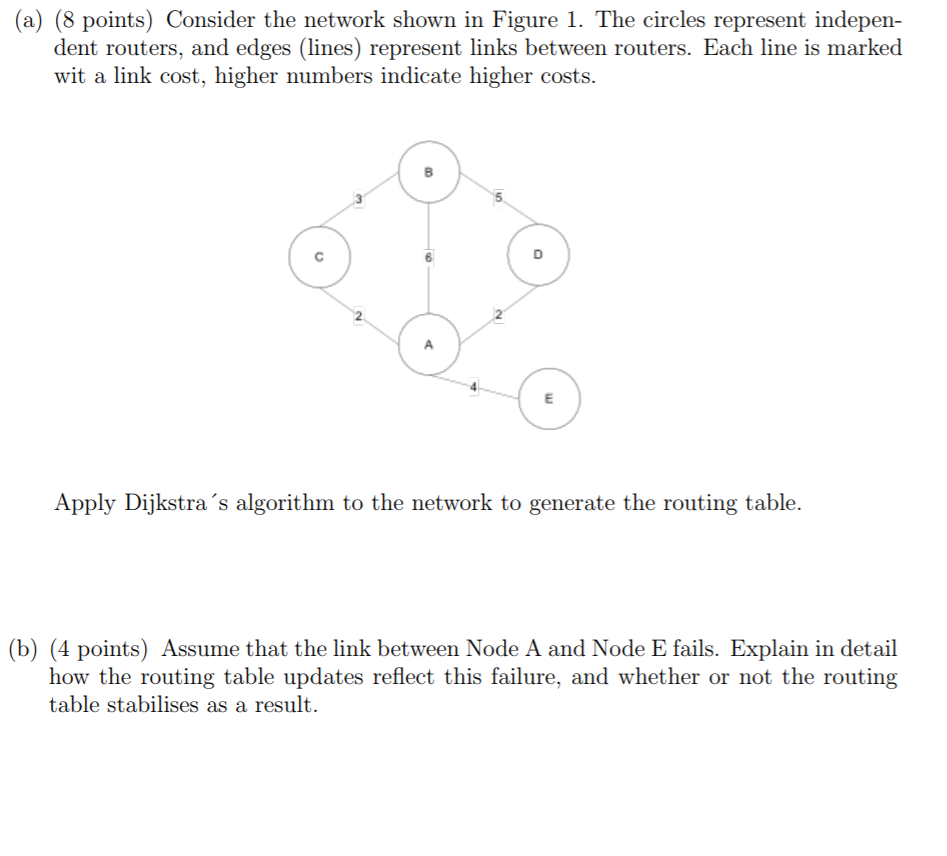
(a) (8 points) Consider the network shown in Figure 1. The circles represent indepen- dent routers, and edges (lines) represent links between routers. Each line is marked wit a link cost, higher numbers indicate higher costs. 5 Apply Dijkstra 's algorithm to the network to generate the routing table b) (4 points) Assume that the link between Node A and Node E fails. Explain in detail how the routing table updates reflect this failure, and whether or not the routing table stabilises as a result
Step by Step Solution
There are 3 Steps involved in it
1 Expert Approved Answer
Step: 1 Unlock

Question Has Been Solved by an Expert!
Get step-by-step solutions from verified subject matter experts
Step: 2 Unlock
Step: 3 Unlock