

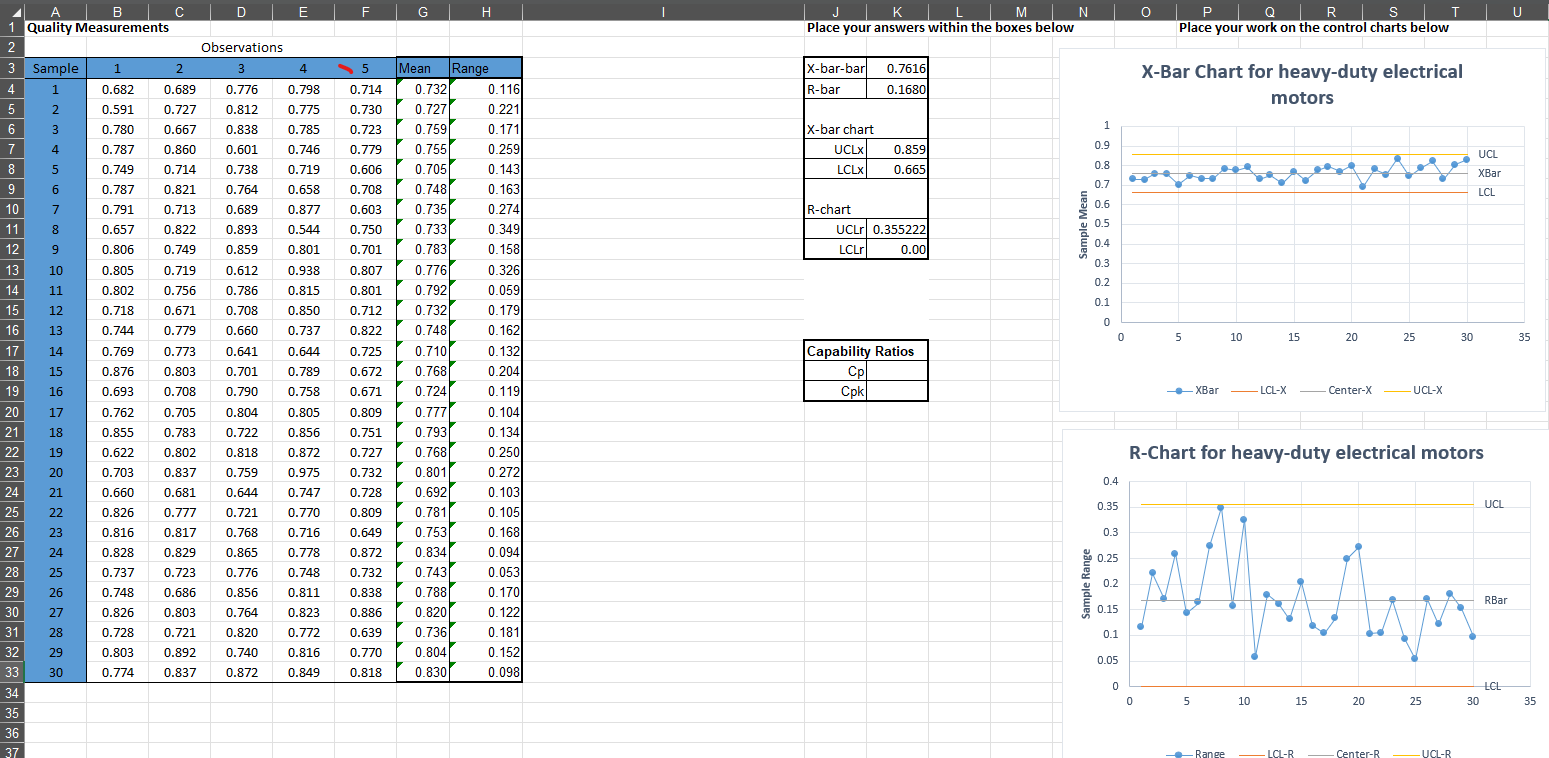
Question: a . Analyze the charts. What do you conclude? b . Calculate the process capability ratios. The specification limits are 0 . 6 7 and
a Analyze the charts. What do you conclude?
b Calculate the process capability ratios. The specification limits are and
c What are your conclusions on process capability?
Step by Step Solution
There are 3 Steps involved in it
1 Expert Approved Answer
Step: 1 Unlock

Question Has Been Solved by an Expert!
Get step-by-step solutions from verified subject matter experts
Step: 2 Unlock
Step: 3 Unlock