

Question: a & b accept / reject irr / wacc please explain 5. NPV profiles An NPV profile plots a project's NPV at various costs of
a & b accept / reject
irr / wacc
please explain
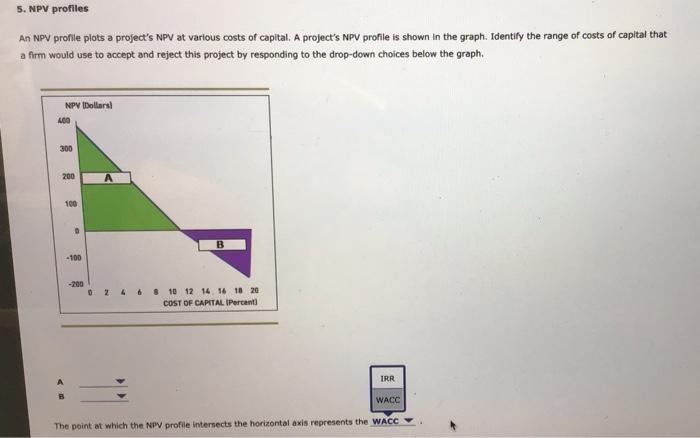
5. NPV profiles An NPV profile plots a project's NPV at various costs of capital. A project's NPV profile is shown in the graph. Identify the range of costs of capital that a firm would use to accept and reject this project by responding to the drop-down choices below the graph. NPV Dollars 400 300 200 100 B -100 -200 0 2 4 6 8 10 12 14 16 18 20 COST OF CAPITAL (Percent IRR WACC The point at which the NPV profile intersects the horizontal axis represents the WACC
Step by Step Solution
There are 3 Steps involved in it
1 Expert Approved Answer
Step: 1 Unlock

Question Has Been Solved by an Expert!
Get step-by-step solutions from verified subject matter experts
Step: 2 Unlock
Step: 3 Unlock