

Question: A B C D E F c. Constructing a graph of the yield curve begin{tabular}{|c|r|} hline Years to Maturity & multicolumn{1}{c|}{ Yield } hline
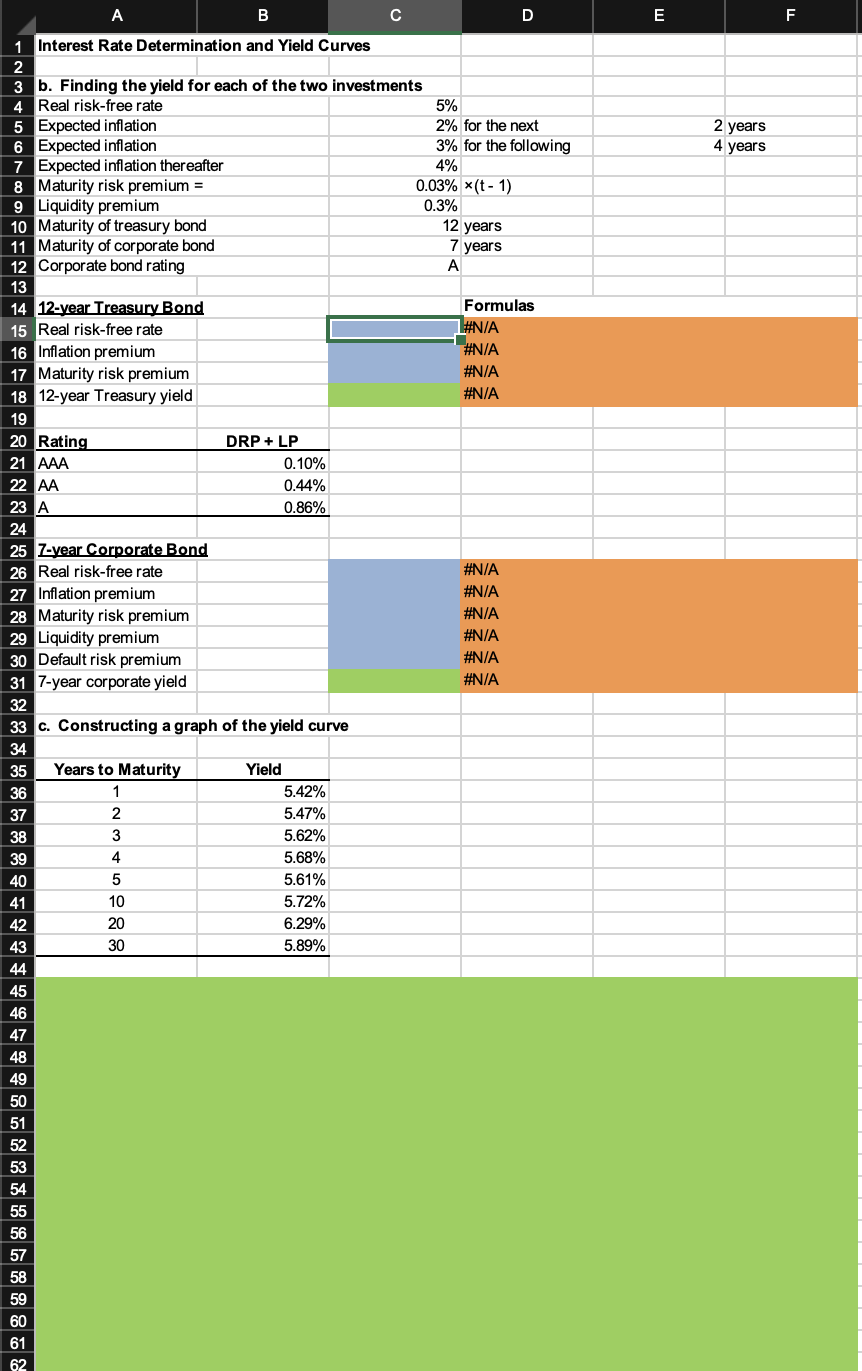
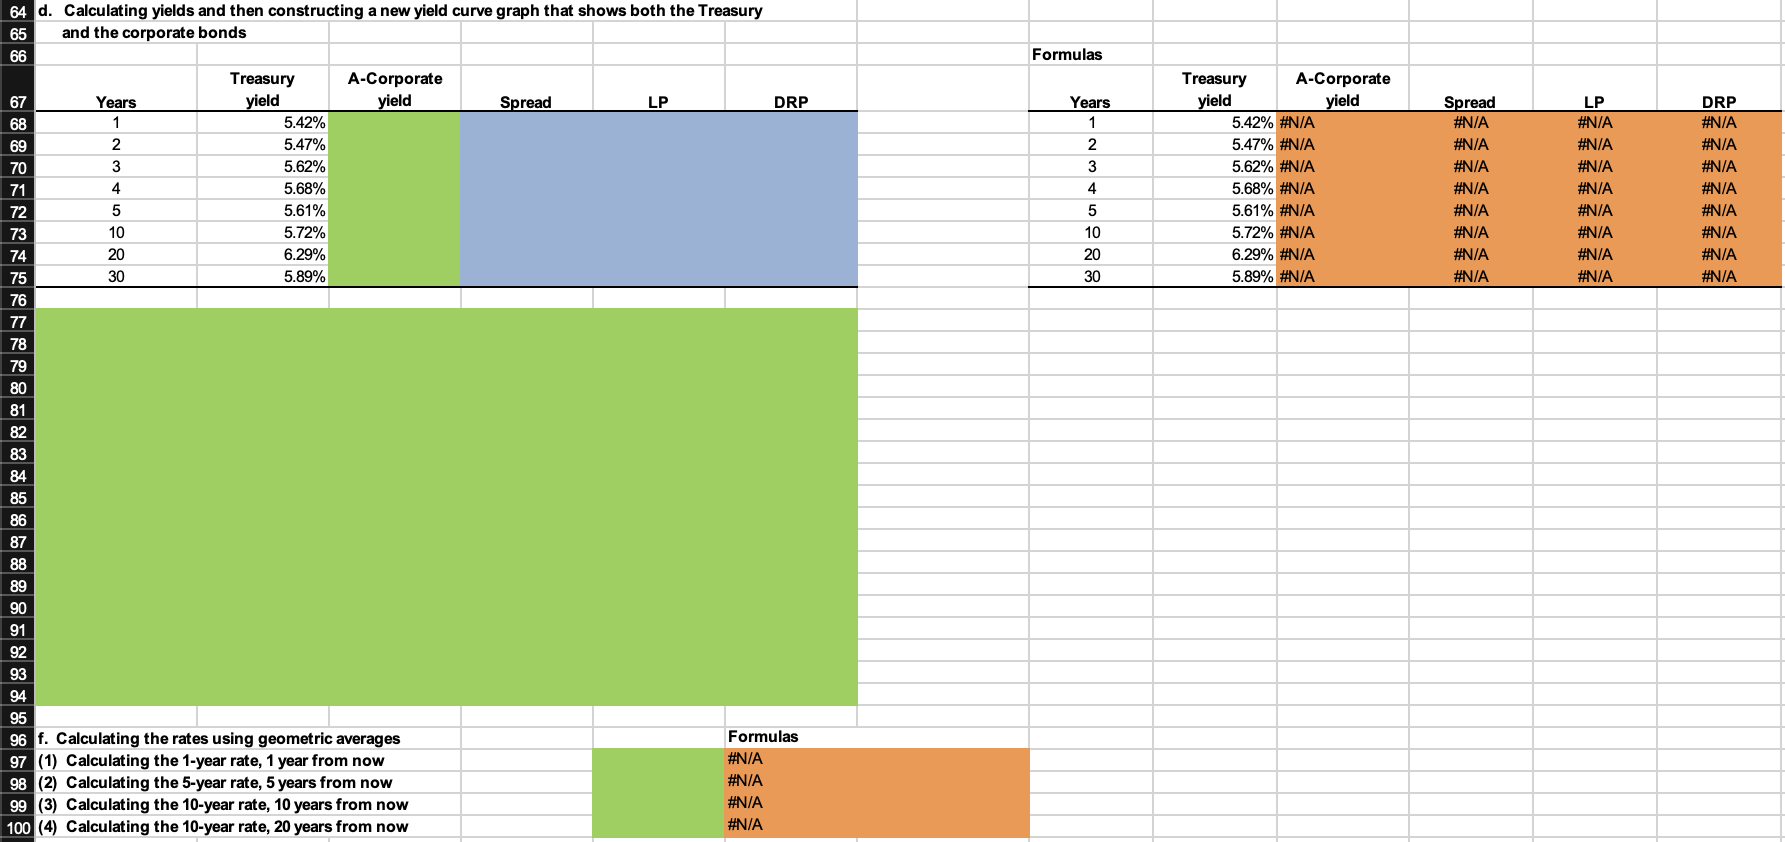
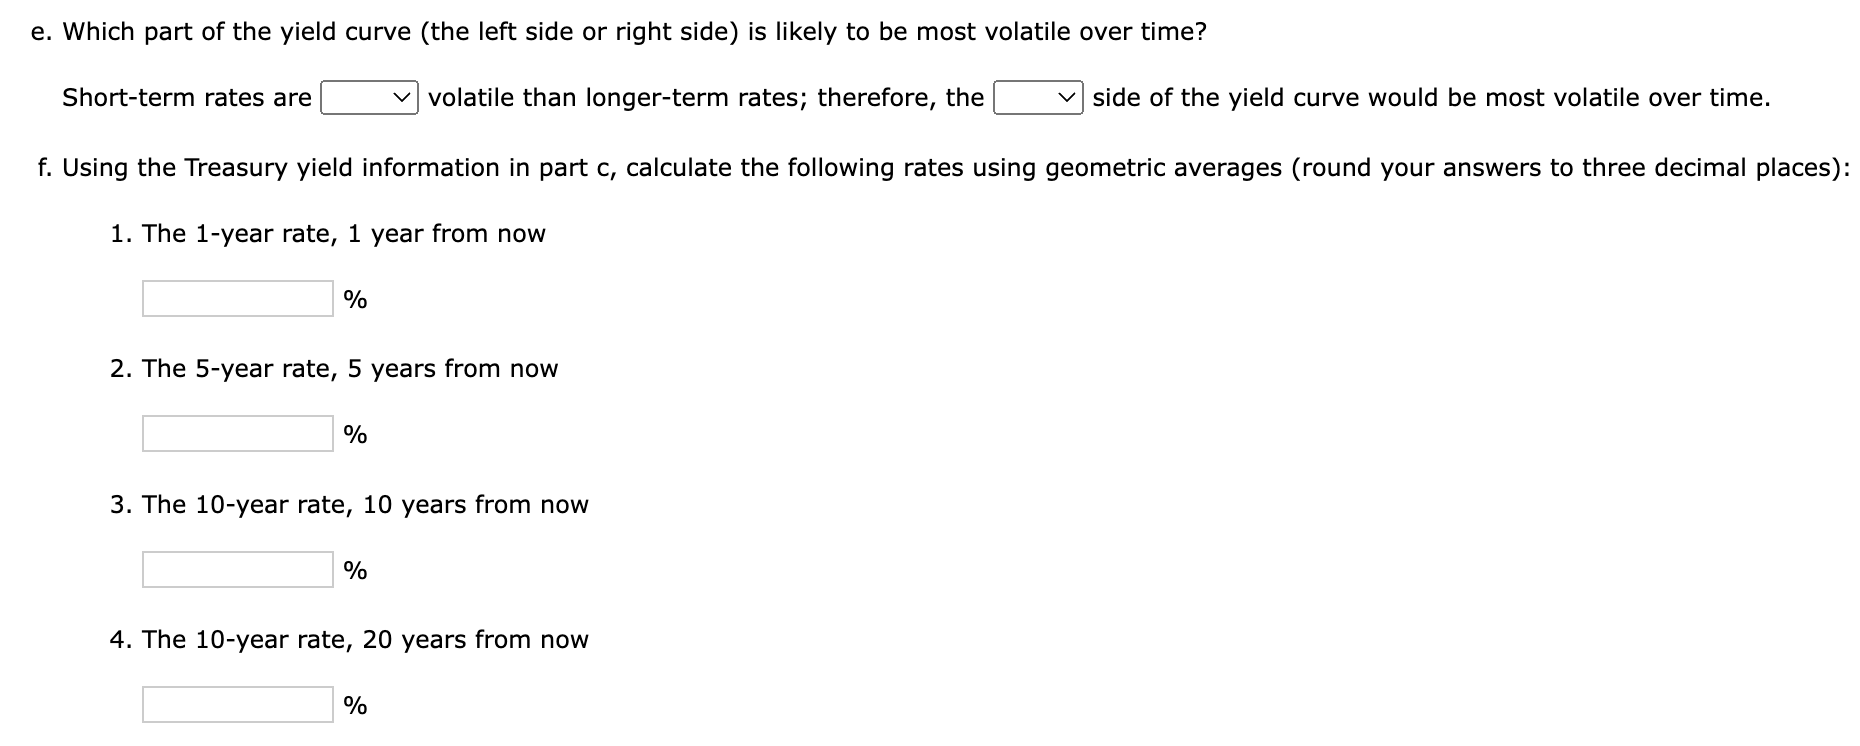
A B C D E F c. Constructing a graph of the yield curve \begin{tabular}{|c|r|} \hline Years to Maturity & \multicolumn{1}{c|}{ Yield } \\ \hline 1 & 5.42% \\ \hline 2 & 5.47% \\ \hline 3 & 5.62% \\ \hline 4 & 5.68% \\ \hline 5 & 5.61% \\ \hline 10 & 5.72% \\ \hline 20 & 6.29% \\ \hline 30 & 5.89% \\ \hline \end{tabular} e. Which part of the yield curve (the left side or right side) is likely to be most volatile over time? Short-term rates are volatile than longer-term rates; therefore, the side of the yield curve would be most volatile over time. f. Using the Treasury yield information in part c, calculate the following rates using geometric averages (round your answers to three decimal places): 1. The 1 -year rate, 1 year from now % 2. The 5-year rate, 5 years from now % 3. The 10-year rate, 10 years from now % 4. The 10-year rate, 20 years from now % A B C D E F c. Constructing a graph of the yield curve \begin{tabular}{|c|r|} \hline Years to Maturity & \multicolumn{1}{c|}{ Yield } \\ \hline 1 & 5.42% \\ \hline 2 & 5.47% \\ \hline 3 & 5.62% \\ \hline 4 & 5.68% \\ \hline 5 & 5.61% \\ \hline 10 & 5.72% \\ \hline 20 & 6.29% \\ \hline 30 & 5.89% \\ \hline \end{tabular} e. Which part of the yield curve (the left side or right side) is likely to be most volatile over time? Short-term rates are volatile than longer-term rates; therefore, the side of the yield curve would be most volatile over time. f. Using the Treasury yield information in part c, calculate the following rates using geometric averages (round your answers to three decimal places): 1. The 1 -year rate, 1 year from now % 2. The 5-year rate, 5 years from now % 3. The 10-year rate, 10 years from now % 4. The 10-year rate, 20 years from now %
Step by Step Solution
There are 3 Steps involved in it

Get step-by-step solutions from verified subject matter experts