

Question: A B C D E F c. Constructing a graph of the yield curve begin{tabular}{|c|r|} hline Years to Maturity & multicolumn{1}{c|}{ Yield } hline
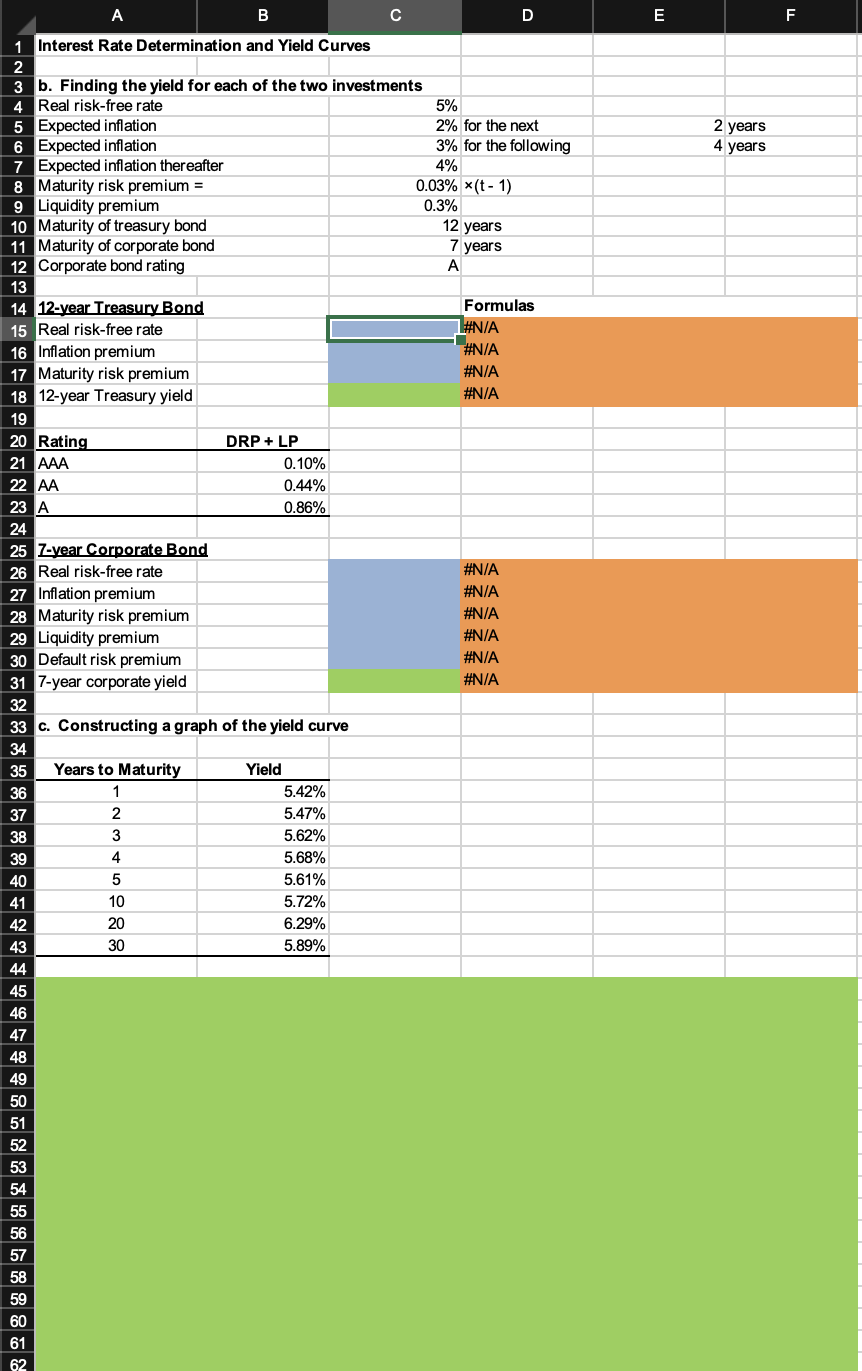
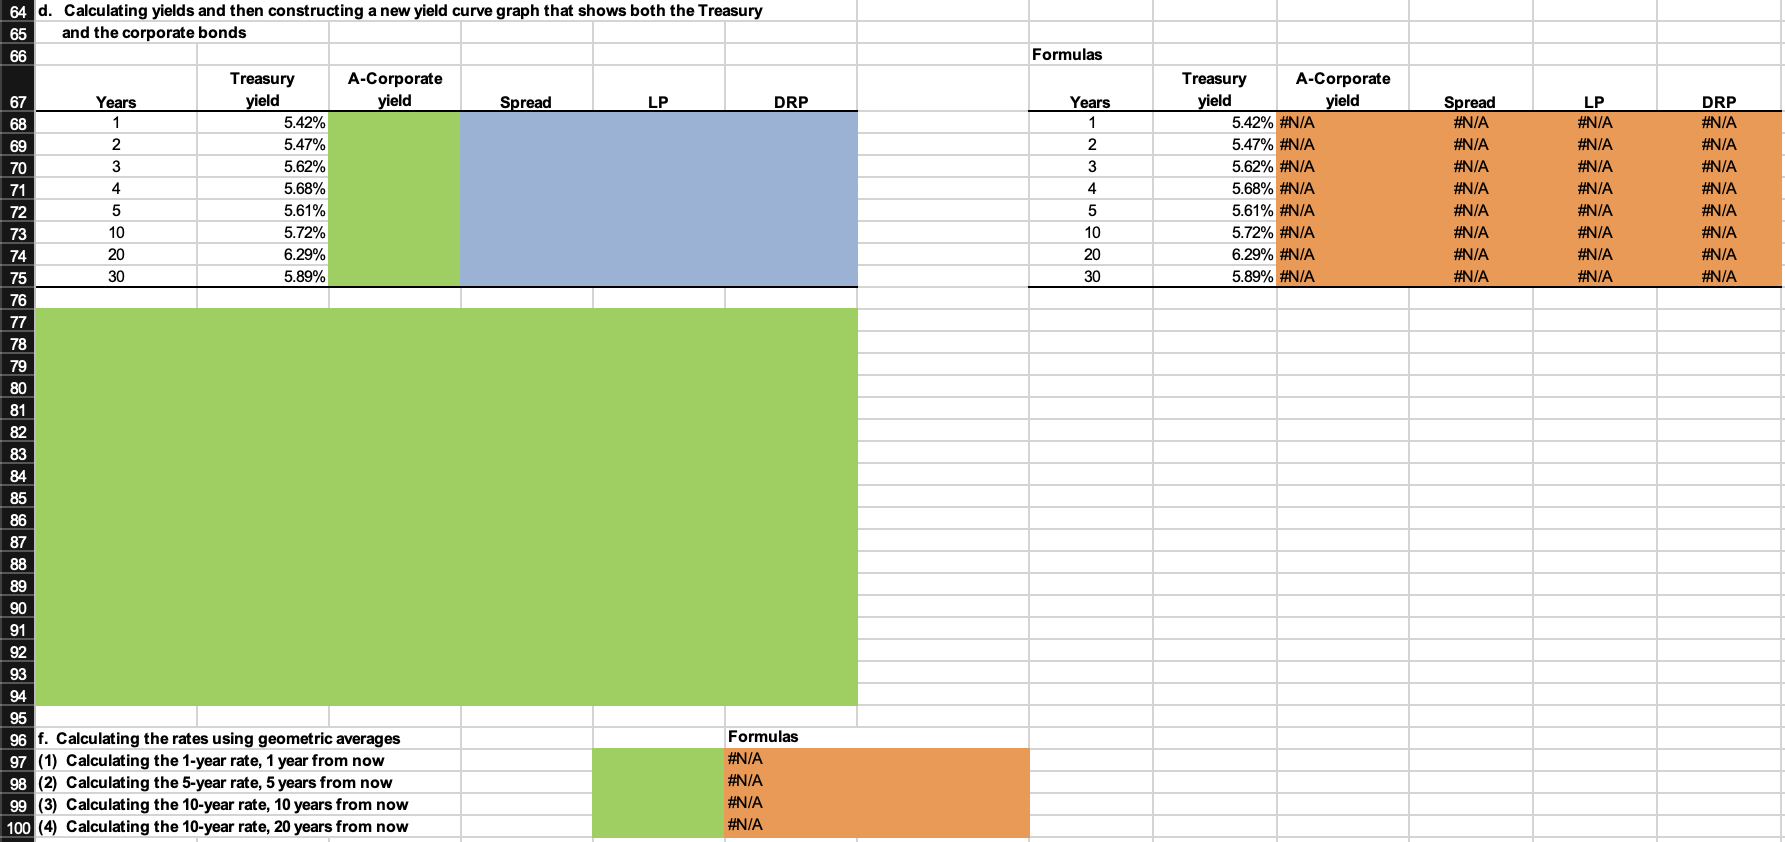
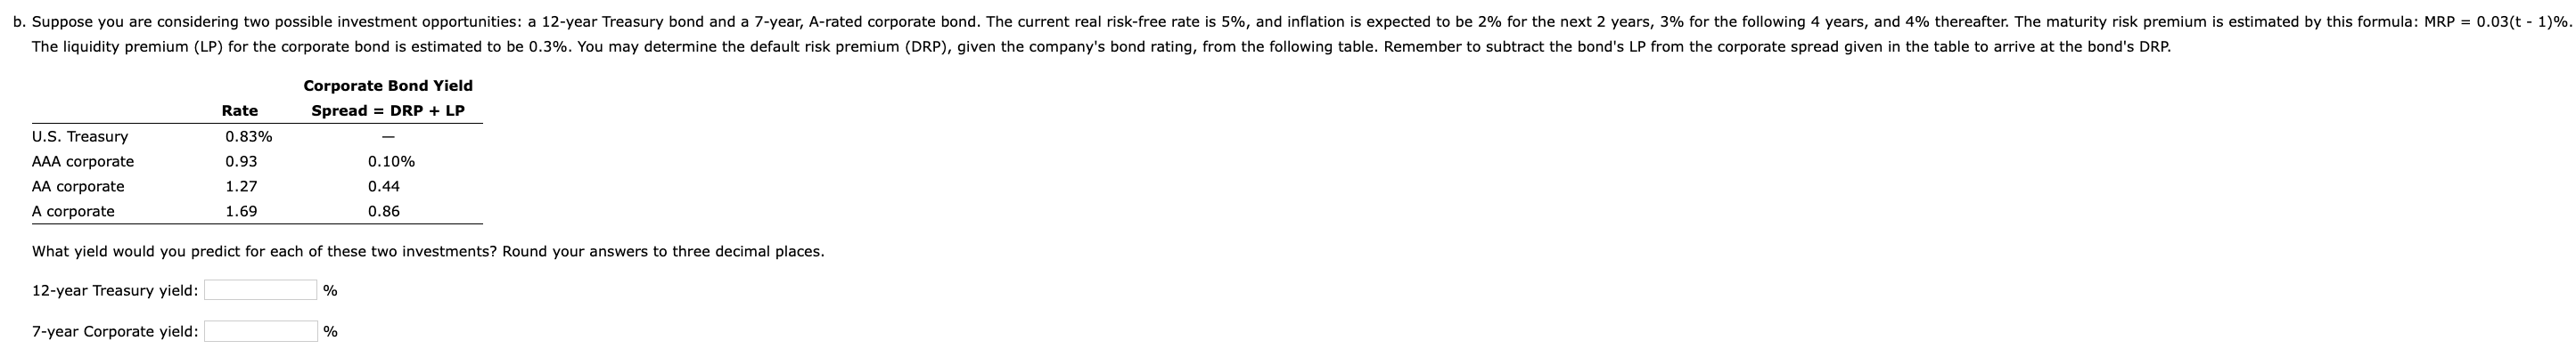
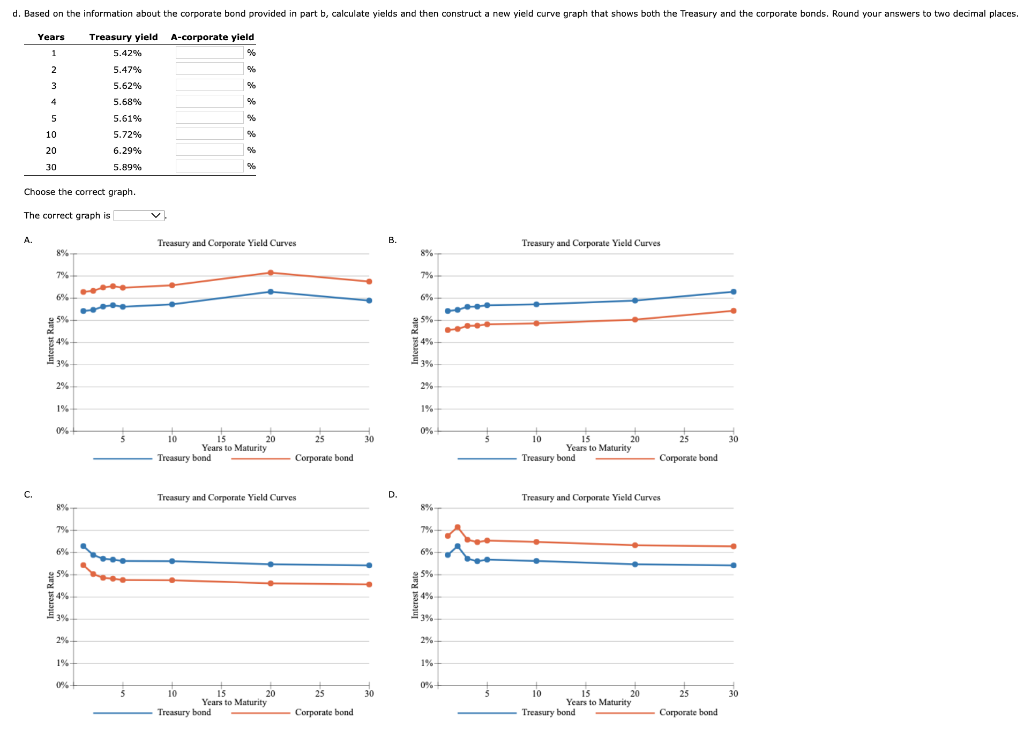
A B C D E F c. Constructing a graph of the yield curve \begin{tabular}{|c|r|} \hline Years to Maturity & \multicolumn{1}{c|}{ Yield } \\ \hline 1 & 5.42% \\ \hline 2 & 5.47% \\ \hline 3 & 5.62% \\ \hline 4 & 5.68% \\ \hline 5 & 5.61% \\ \hline 10 & 5.72% \\ \hline 20 & 6.29% \\ \hline 30 & 5.89% \\ \hline \end{tabular} What yield would you predict for each of these two investments? Round your answers to three decimal places. 12-year Treasury yield: 7-year Corporate yield: Choose the correct graph. The correct graph is A B C D E F c. Constructing a graph of the yield curve \begin{tabular}{|c|r|} \hline Years to Maturity & \multicolumn{1}{c|}{ Yield } \\ \hline 1 & 5.42% \\ \hline 2 & 5.47% \\ \hline 3 & 5.62% \\ \hline 4 & 5.68% \\ \hline 5 & 5.61% \\ \hline 10 & 5.72% \\ \hline 20 & 6.29% \\ \hline 30 & 5.89% \\ \hline \end{tabular} What yield would you predict for each of these two investments? Round your answers to three decimal places. 12-year Treasury yield: 7-year Corporate yield: Choose the correct graph. The correct graph is
Step by Step Solution
There are 3 Steps involved in it

Get step-by-step solutions from verified subject matter experts