

Question: A B C D E F G 1 Regression Analysis Regression Statistics of the variation in home market values Multiple R 0.731255223 can be explained
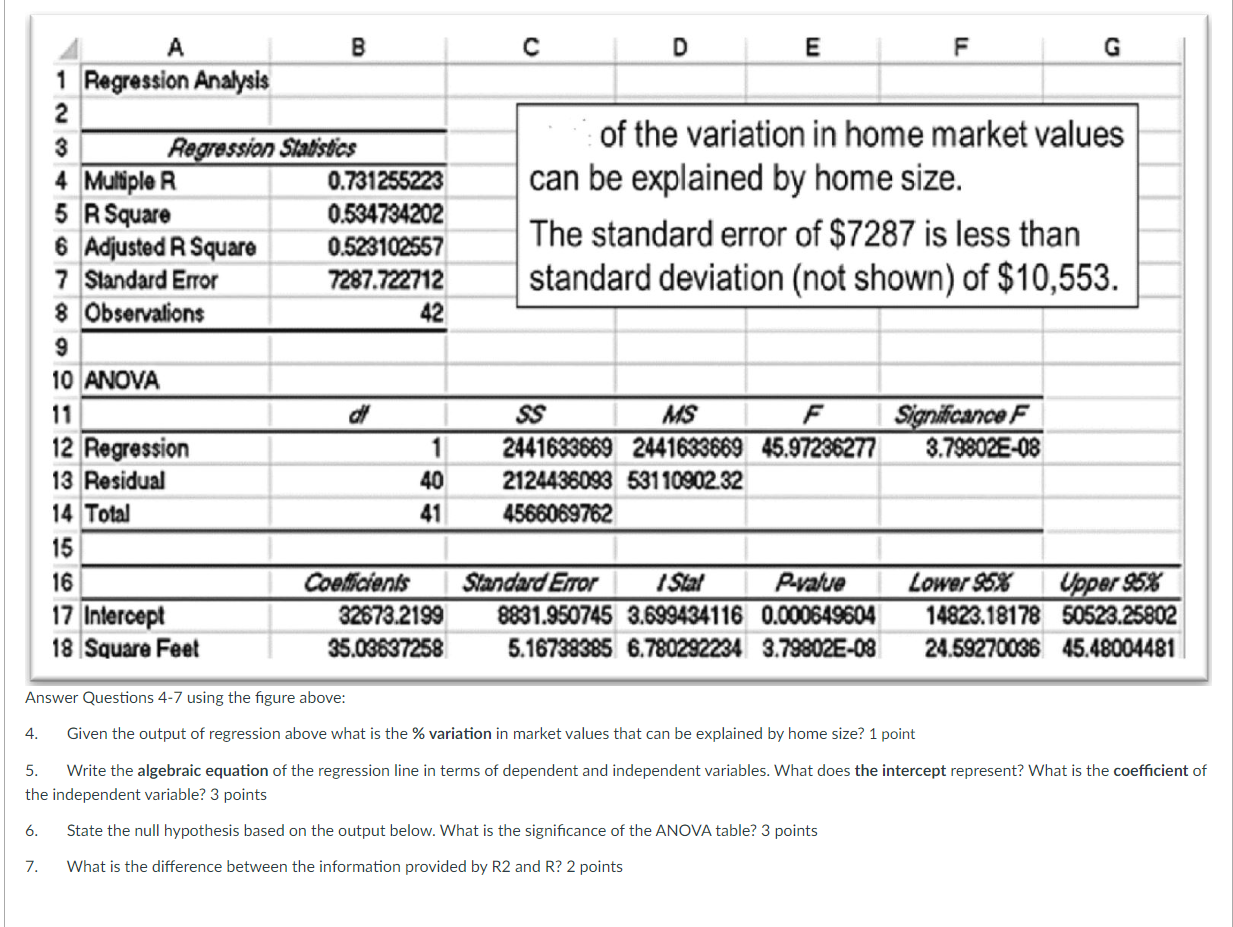

A B C D E F G 1 Regression Analysis Regression Statistics of the variation in home market values Multiple R 0.731255223 can be explained by home size. 5 R Square 0.534734202 6 Adjusted R Square 0.523102557 The standard error of $7287 is less than 7 Standard Error 7287.722712 standard deviation (not shown) of $10,553. 8 Observations 42 9 10 ANOVA 11 SS MS F Significance F 12 Regression 2441683669 2441633669 45.97236277 3,79802E-08 13 Residual 40 2124436093 531 10902.32 14 Total 41 4566069762 15 16 Coefficients Standard Error I Stal P-value Lower 95X Upper 95% 17 Intercept 32673.2199 8831.950745 3.699434116 0.000649604 14823.18178 50523.25802 18 Square Feet 35.03637258 5.16738385 6.780292234 3.79802E-08 24.59270036 45.48004481 Answer Questions 4-7 using the figure above: 4. Given the output of regression above what is the % variation in market values that can be explained by home size? 1 point 5. Write the algebraic equation of the regression line in terms of dependent and independent variables. What does the intercept represent? What is the coefficient of the independent variable? 3 points 6. State the null hypothesis based on the output below. What is the significance of the ANOVA table? 3 points 7. What is the difference between the information provided by R2 and R? 2 points
Step by Step Solution
There are 3 Steps involved in it

Get step-by-step solutions from verified subject matter experts