

Question: A B C D E F G H K M 1 Yea-T First Last P/ Plac Every Team Time |Individual Time Swim Transition 1 Bike
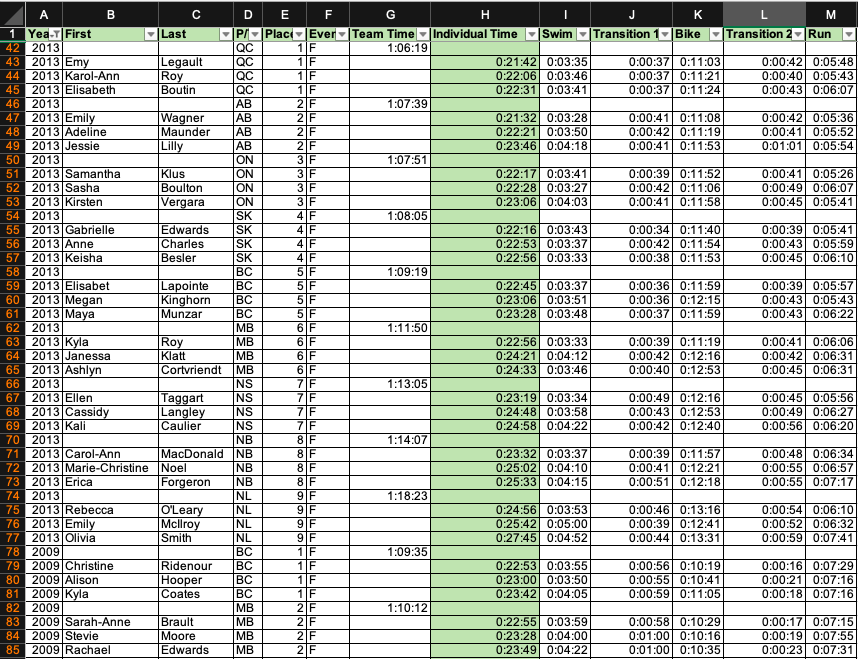
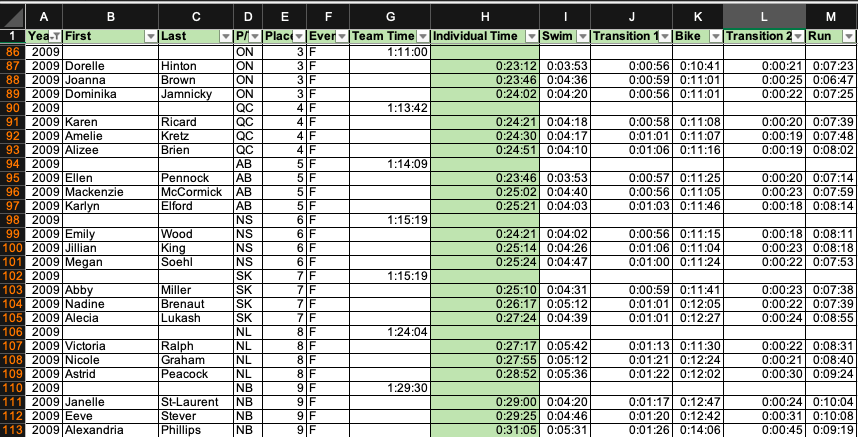
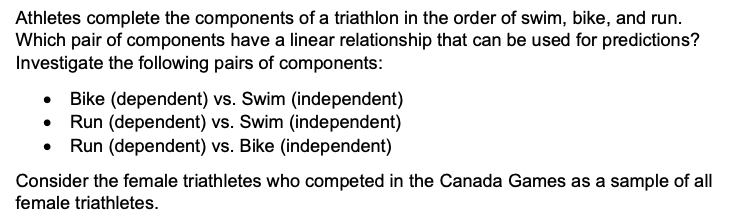
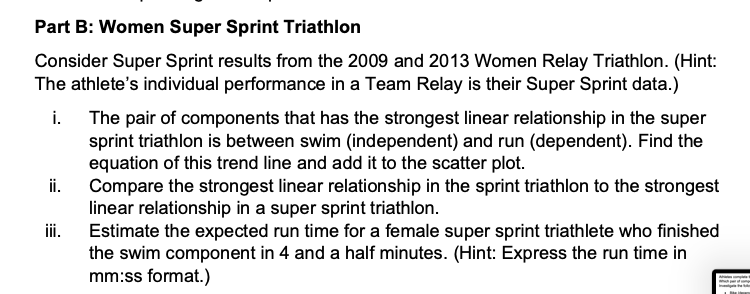
A B C D E F G H K M 1 Yea-T First Last P/ Plac Every Team Time |Individual Time Swim Transition 1 Bike . Transition 2 Run 42 2013 QC 1F 1:06:19 43 2013 Emy Legault QC 1F 0:21:42 0:03:35 0:00:37 0:11:03 0:00:42 0:05:48 44 2013 Karol-Ann Roy QC 1F 0:22:06 0:03:46 0:00:37 0:11:21 0:00:40 0:05:43 45 2013 Elisabeth Boutin QC 1 F 0:22:31 0:03:41 0:00:37 0:11:24 0:00:43 0:06:07 46 2013 AB 2 F 1:07:39 47 2013 Emily Wagner AB 2 F 0:21:32 0:03:28 0:00:41 0:11:08 0:00:42 0:05:36 48 2013 Adeline Maunder AB 2 F 0:22:21 0:03:50 0:00:42 0:11:19 0:00:41 0:05:52 9 2013 Jessie Lilly AB 2 F 0:23:46 0:04:18 0:00:41 0:11:53 0:01:01 0:05:54 50 2013 ON 3 F 1:07:51 51 2013 Samantha Klus ON 3 F 0:22:17 0:03:41 0:00:39 0:11:52 0:00:41 0:05:26 52 2013 Sash Boulton ON 3 F 0:22:28 0:03:27 0:00:42 0:11:06 0:00:49 0:06:07 53 2013 Kirsten Vergara ON 3 F 0:23:06 0:04:03 0:00:41 0:11:58 0:00:45 0:05:41 54 2013 SK 4 F 1:08:05 55 2013 Gabrielle Edwards SK 4 F 0:22:16 0:03:43 0:00:34 0:11:40 0:00:39 0:05:41 56 2013 Anne Charles SK 4 F 0:22:53 0:03:37 :00:42 0:11:54 0:00:43 0:05:59 57 2013 Keisha Besler SK 4F 0:22:56 0:03:33 ):00:38 0:11:53 0:00:45 0:06:10 58 2013 BC 1:09:19 59 2013 Elisabet Lapointe BC 5 8 0:22:45 0:03:37 0:00:36 0:11:59 0:00:39 0:05:57 60 2013 Megan Kinghorn BC 0:23:06 0:03:51 0:00:36 0:12:15 0:00:43 0:05:43 61 2013 Maya Munzal BC 5 F 0:23:28 0:03:48 0:00:37 0:11:59 0:00:43 0:06:22 62 2013 MB 6F 1:11:50 32013 Kyla Roy MB 6F 0:22:56 0:03:33 0:00:39 0:11:19 0:00:41 0:06:06 64 2013 Janessa Klatt MB 6 F 0:24:21 0:04:12 0:00:42 0:12:16 0:00:42 0:06:31 65 2013 Ashlyn Cortvriendt MB 6 F 0:24:33 0:03:46 0:00:40 0:12:53 0:00:45 0:06:31 6 2013 NS 78 1:13:05 67 2013 Ellen Taggart NS 7 F 0:23:19 0:03:34 0:00:49 0:12:16 0:00:45 0:05:56 68 2013 Cassidy Langley NS 7F 0:24:48 0:03:58 0:00:43 0:12:53 0:00:49 0:06:27 69 2013 Kali Caulier NS 7 F 0:24:58 0:04:22 0:00:42 0:12:40 0:00:56 0:06:20 70 2013 NB 8 F 1:14:07 71 2013 Carol-Ann MacDonald NB 8 F 0:23:32 0:03:37 0:00:39 0:11:57 0:00:48 0:06:34 2013 Marie-Christine |Noe NB 8 F 0:25:02 0:04:10 0:00:41 0:12:21 0:00:55 0:06:57 73 2013 Erica Forgeron NB 8 F 0:25:33 0:04:15 0:00:51 0:12:18 0:00:55 0:07:17 74 2013 NL 9 F 1:18:23 75 2013 Rebecca O'leary NL 9 F 0:24:56 0:03:53 0:00:46 0:13:16 0:00:54 0:06:10 5 2013 Emily Mellroy NL 9 F 0:25:42 0:05:00 0:00:39 0:12:41 0:00:52 0:06:32 2013 Olivia Smith NL 9F 0:27:45 0:04:52 0:00:44 0:13:31 0:00:59 0:07:41 78 2009 BC 1 F 1:09:35 79 2009 Christine Ridenour BC 1 F 0:22:53 0:03:55 0:00:56 0:10:19 0:00:16 0:07:29 80 2009 Alison Hoope BC 1 F 0:23:00 0:03:50 ):00:55 0:10:41 0:00:21 0:07:16 81 2009 Kyla Coates BC 1 F 0:23:42 0:04:05 1:00:59 0:11:05 0:00:18 0:07:16 82 2009 MB 2F 1:10:12 83 2009 Sarah-Anne Brault MB 21 0:22:55 0:03:59 0:00:58 0:10:29 0:00:17 0:07:15 84 2009 Stevie Moore MB 2 F 0:23:28 0:04:00 0:01:00 0:10:16 0:00:19 0:07:55 85 2009 Rachael Edwards MB 2 F 0:23:49 0:04:22 0:01:00 0:10:35 0:00:23 0:07:31A B C D E F G H I K L M 1 Yea-T First Last P/ Plac Every Team Time |Individual Time |Swim . Transition 17 Bike Transition 2 Run 86 2009 ON 3 F 1:11:00 87 2009 Dorelle Hinton ON 3 F 0:23:12 0:03:53 0:00:56 0:10:41 0:00:21 0:07:23 88 2009 Joanna Brown ON 3 F 0:23:46 0:04:36 0:00:59 0:11:01 0:00:25 0:06:47 89 2009 Dominika Jamnicky ON 3 F 0:24:02 0:04:20 0:00:56 0:11:01 0:00:22 0:07:25 90 2009 QC 4 F 1:13:42 91 2009 Karen Ricard QC 4 F 0:24:21 0:04:18 0:00:58 0:11:08 0:00:20 0:07:39 92 2009 Amelie Kretz QC 4 F 0:24:30 0:04:17 0:01:01 0:11:07 0:00:19 0:07:48 93 2009 Alizee Brien QC 4 F 0:24:51 0:04:10 0:01:06 0:11:16 0:00:19 0:08:02 94 2009 AB 5 F 1:14:09 95 2009 Ellen Pennock AB 5 F 0:23:46 0:03:53 0:00:57 0:11:25 0:00:20 0:07:14 96 2009 Mackenzie Mccormick AB 5 F 0:25:02 0:04:40 0:00:56 0:11:05 0:00:23 0:07:59 97 2009 Karlyn Elford AB 5 F 0:25:21 0:04:03 0:01:03 0:11:46 0:00:18 0:08:14 98 2009 NS 6 F 1:15:19 99 2009 Emily Wood NS 6 F 0:24:21 0:04:02 0:00:56 0:11:15 0:00:18 0:08:11 100 2009 Jillian King NS 6 F 0:25:14 0:04:26 0:01:06 0:11:04 0:00:23 0:08:18 101 2009 Megan Soehl NS 6 F 0:25:24 0:04:47 0:01:00 0:11:24 0:00:22 0:07:53 102 2009 SK 7 F 1:15:19 103 2009 Abby Miller SK 7 F 0:25:10 0:04:31 0:00:59 0:11:41 0:00:23 0:07:38 104 2009 Nadine Brenaut SK 7 F 0:26:17 0:05:12 0:01:01 0:12:05 0:00:22 0:07:39 105 2009 Alecia Lukash SK 7 F 0:27:24 0:04:39 0:01:01 0:12:27 0:00:24 0:08:55 106 2009 NL 8 F 1:24:04 107 2009 Victoria Ralph NL 8 F 0:27:17 0:05:42 0:01:13 0:11:30 0:00:22 0:08:31 108 2009 Nicole Graham NL 8 F 0:27:55 0:05:12 0:01:21 0:12:24 0:00:21 0:08:40 109 2009 Astrid Peacock NL 8 F 0:28:52 0:05:36 0:01:22 0:12:02 0:00:30 0:09:24 110 2009 NB 9 F 1:29:30 111 2009 Janelle St-Laurent NB 9 F 0:29:00 0:04:20 0:01:17 0:12:47 0:00:24 0:10:04 112 2009 Eeve Stever NB 9 F 0:29:25 0:04:46 0:01:20 0:12:42 0:00:31 0:10:08 113 2009 Alexandria Phillips NB 9 F 0:31:05 0:05:31 0:01:26 0:14:06 0:00:45 0:09:19Athletes complete the components of a triathlon in the order of swim, bike, and run. Which pair of components have a linear relationship that can be used for predictions? Investigate the following pairs of components: Bike (dependent) vs. Swim (independent) Run (dependent) vs. Swim (independent) . Run (dependent) vs. Bike (independent) Consider the female triathletes who competed in the Canada Games as a sample of all female triathletes.Part B: Women Super Sprint Triathlon Consider Super Sprint results from the 2009 and 2013 Women Relay Triathlon. (Hint: The athlete's individual performance in a Team Relay is their Super Sprint data.) i. The pair of components that has the strongest linear relationship in the super sprint triathlon is between swim {independent} and run {dependent}. Find the equation of this trend line and add it to the scatter plot. ii. Compare the strongest linear relationship in the sprint triathlon to the strongest linear relationship in a super sprint triathlon. iii. Estimate the expected n.rn time for a female super sprint triathlete who nished the swim component in 4 and a half minutes. (Hint: Express the n.rn time in mm:ss format.)
Step by Step Solution
There are 3 Steps involved in it

Get step-by-step solutions from verified subject matter experts