

Question: Problem 2: Return on Assets by Company, 2007 % Your Company 8.3 Competitor A 9.8 Competitor B 15.9 Competitor C 22.4 Competitor D 14.7 Competitor
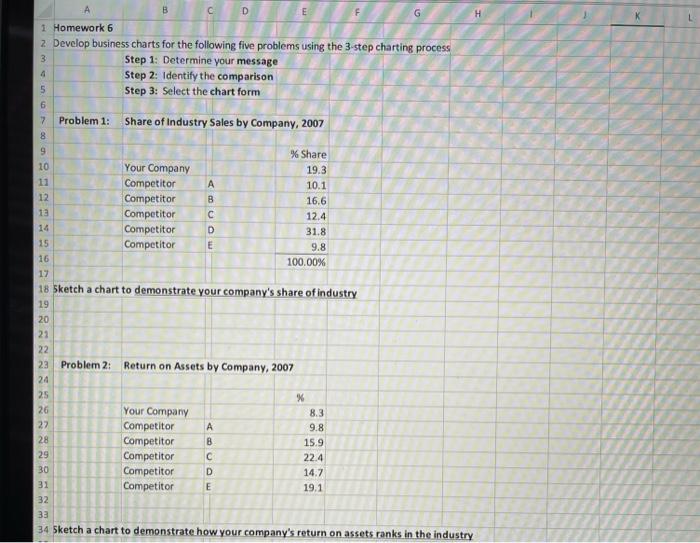
| Problem 2: | Return on Assets by Company, 2007 | ||||||
| % | |||||||
| Your Company | 8.3 | ||||||
| Competitor | A | 9.8 | |||||
| Competitor | B | 15.9 | |||||
| Competitor | C | 22.4 | |||||
| Competitor | D | 14.7 | |||||
| Competitor | E | 19.1 | |||||
| Sketch a chart to demonstrate how your company's return on assets ranks in the industry | |||||||
Step by Step Solution
There are 3 Steps involved in it
1 Expert Approved Answer
Step: 1 Unlock

Question Has Been Solved by an Expert!
Get step-by-step solutions from verified subject matter experts
Step: 2 Unlock
Step: 3 Unlock