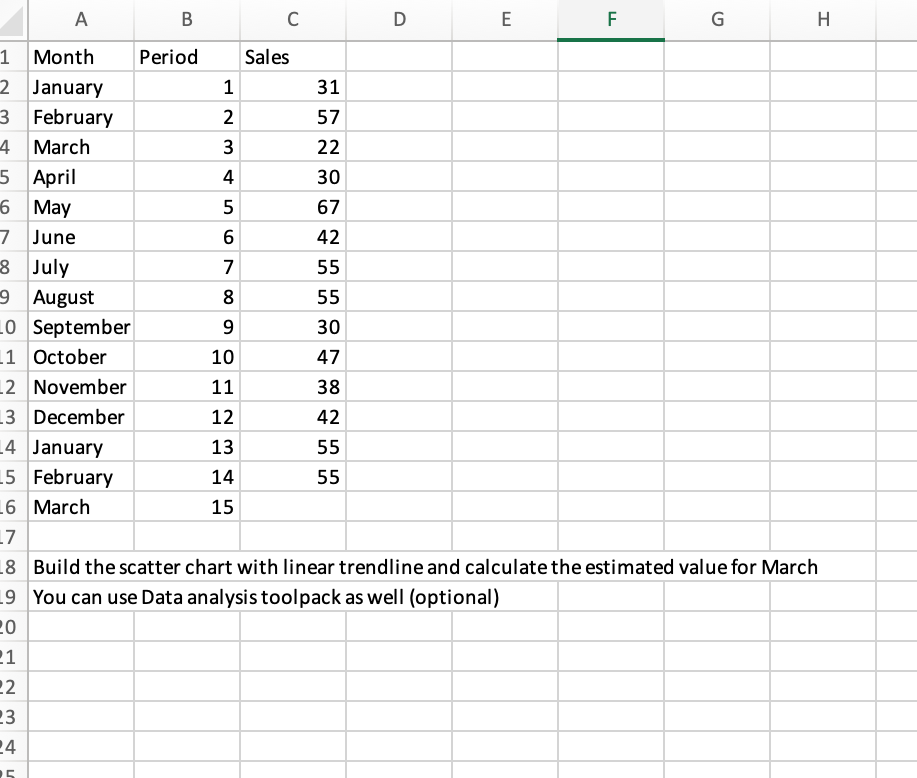
Question: A B D E F G . min 000 1 Month Period Sales 2 January 1 31 3 February 2 57 4 March 3 22

A B D E F G . min 000 1 Month Period Sales 2

A B D E F G . min 000 1 Month Period Sales 2 January 1 31 3 February 2 57 4 March 3 22 5 April 4 30 16 May 67 7 June 6 42 8 July 7 55 9 August 8 55 LO September 9 30 1 October 10 47 L2 November 11 38 23 December 12 42 14 January 13 55 -5 February 14 55 6 March 15 7 8 Build the scatter chart with linear trendline and calculate the estimated value for March 9 You can use Data analysis toolpack as well (optional) 20 1 2 3 24 15

Step by Step Solution

There are 3 Steps involved in it

1 Expert Approved Answer
Step: 1 Unlock blur-text-image
Question Has Been Solved by an Expert!

Get step-by-step solutions from verified subject matter experts

Step: 2 Unlock
Step: 3 Unlock

Students Have Also Explored These Related General Management Questions!