

A bakerys quarterly sales of a product (in thousands), as well as forecast demands, are shown in
Fantastic news! We've Found the answer you've been seeking!
Question:
A bakery’s quarterly sales of a product (in thousands), as well as forecast demands, are shown in the following table:
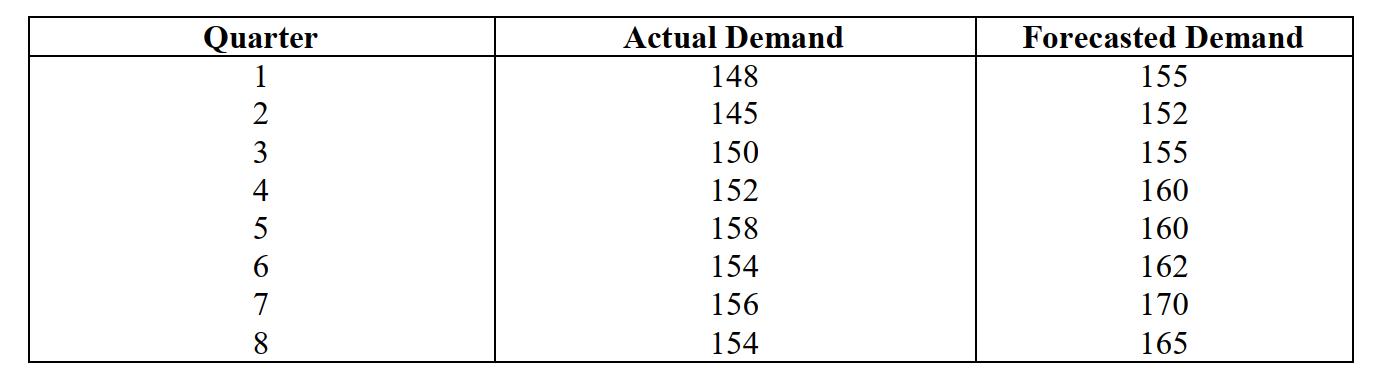
| i. ii. | Compute the tracking signals for each of the periods. Check whether forecasts are performing adequately within range -2MAD to +2MAD |
Expert Answer:
Find below table with all the calculation Quarter Acutl Demand Forecasted Demand Error ... View the full answer

Related Book For 

Applied Regression Analysis and Other Multivariable Methods
ISBN: 978-1285051086
5th edition
Authors: David G. Kleinbaum, Lawrence L. Kupper, Azhar Nizam, Eli S. Rosenberg
Posted Date:
