

Question: A baseball pitcher, concerned about losing speed from his fastball, undertook a new training regimen during the offseason. His team's pitching coach measured the
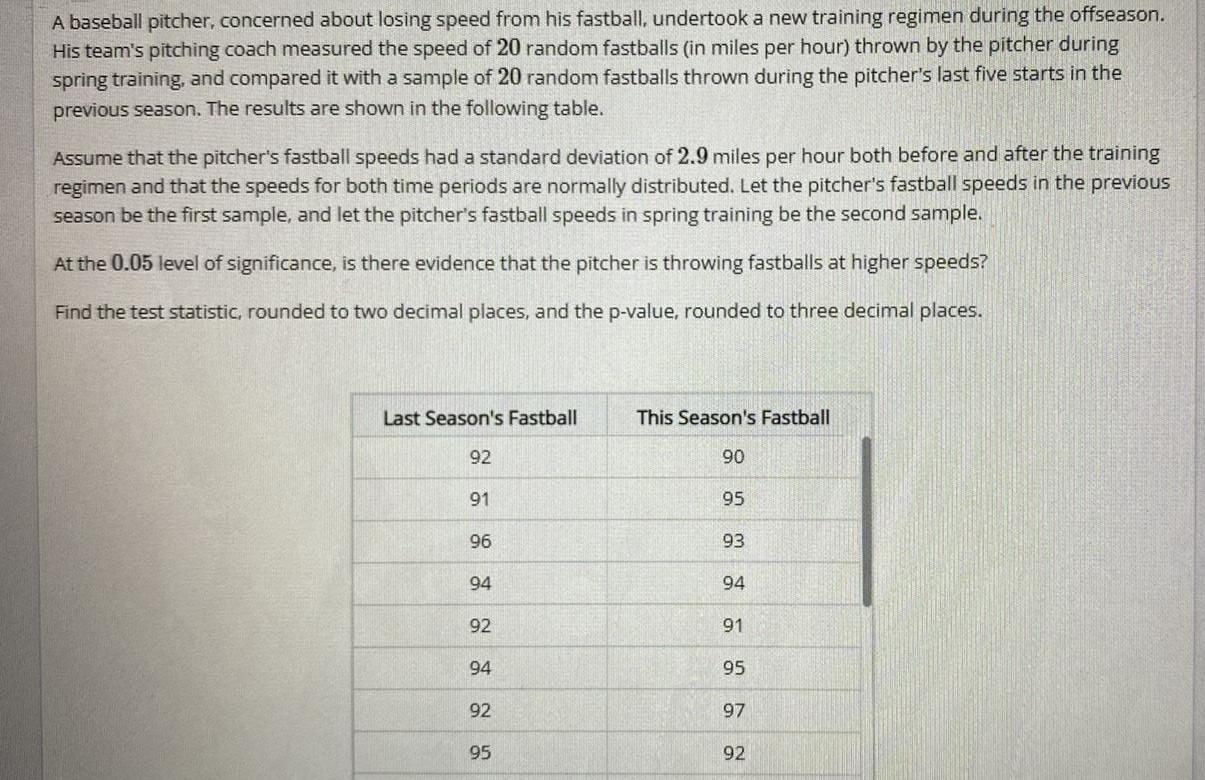
A baseball pitcher, concerned about losing speed from his fastball, undertook a new training regimen during the offseason. His team's pitching coach measured the speed of 20 random fastballs (in miles per hour) thrown by the pitcher during spring training, and compared it with a sample of 20 random fastballs thrown during the pitcher's last five starts in the previous season. The results are shown in the following table. Assume that the pitcher's fastball speeds had a standard deviation of 2.9 miles per hour both before and after the training regimen and that the speeds for both time periods are normally distributed. Let the pitcher's fastball speeds in the previous season be the first sample, and let the pitcher's fastball speeds in spring training be the second sample. At the 0.05 level of significance, is there evidence that the pitcher is throwing fastballs at higher speeds? Find the test statistic, rounded to two decimal places, and the p-value, rounded to three decimal places. Last Season's Fastball This Season's Fastball 92 90 91 95 96 93 94 94 92 91 94 95 92 97 95 92
Step by Step Solution
There are 3 Steps involved in it

Get step-by-step solutions from verified subject matter experts